2000 United States presidential election in New York
The 2000 United States presidential election in New York took place on November 7, 2000 as part of the 2000 United States presidential election. Voters chose 33 representatives, or electors to the Electoral College, who voted for president and vice president.
| |||||||||||||||||||||||||||||
| Turnout | 60.7% | ||||||||||||||||||||||||||||
|---|---|---|---|---|---|---|---|---|---|---|---|---|---|---|---|---|---|---|---|---|---|---|---|---|---|---|---|---|---|
| |||||||||||||||||||||||||||||
 County Results
| |||||||||||||||||||||||||||||
| |||||||||||||||||||||||||||||
| Elections in New York State | ||||||||||||
|---|---|---|---|---|---|---|---|---|---|---|---|---|
 | ||||||||||||
|
||||||||||||
|
|
||||||||||||
|
||||||||||||
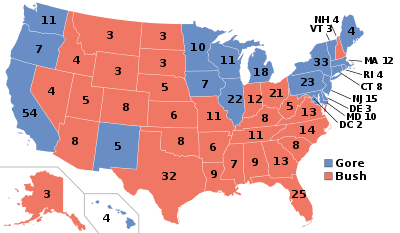
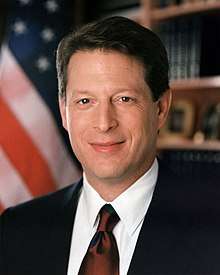
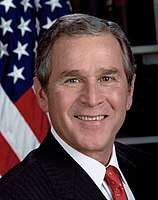
New York was won by the Incumbent Democratic Vice President of the United States Al Gore in a landslide victory; Gore received 60.22% of the vote to Republican George W. Bush's 35.22%, a Democratic victory margin of 25.00%. This marked the first time since 1964 that a Democratic presidential candidate won more than 60% of the vote in New York State, and only the second time in history, solidifying New York's status as a solid blue state in the 21st century. New York weighed in as about 25% more Democratic than the national average in the 2000 election.
The key to Gore's victory was wide margins of victory in greater New York City and Long Island. He did win some counties in upstate New York, but won with small margins, except for Albany County, which voted almost exactly the same as the statewide results. Since third-party candidates received over 4% of the vote, Bush did very poorly. Although, Bush did win a majority of the counties in upstate New York, including his largest victory in rural Hamilton County. Bush won just four congressional districts, including New York's 22nd congressional district, New York's 23rd congressional district, New York's 27th congressional district, and New York's 31st congressional district. As of the 2016 presidential election, this is the last election in which the Democratic candidate won Montgomery County.
Democratic primary
Polling
| Source | Date | Al Gore | Bill Bradley |
|---|---|---|---|
| Quinnipiac | July 1, 1999 | 52% | 34% |
| Quinnipiac | August 2, 1999 | 47% | 38% |
| Quinnipiac | September 15, 1999 | 42% | 40% |
| Quinnipiac | October 3, 1999 | 41% | 44% |
| Quinnipiac | November 11, 1999 | 38% | 47% |
| Quinnipiac | December 14, 1999 | 42% | 39% |
| Quinnipiac | January 19, 2000 | 44% | 39% |
| Quinnipiac | February 10, 2000 | 56% | 32% |
| Quinnipiac | March 1, 2000 | 59% | 33% |
| Quinnipiac | March 6, 2000 | 60% | 32% |
Republican primary
Polling
| Source | Date | Lamar Alexander | Gary Bauer | Patrick Buchanan | George W. Bush | Elizabeth Dole | Steve Forbes | Orrin Hatch | John Kasich | Alan Keyes | John McCain | Dan Quayle | Bob Smith |
|---|---|---|---|---|---|---|---|---|---|---|---|---|---|
| Quinnipiac | July 1, 1999 | 6% | 1% | 1% | 56% | 13% | 3% | - | 2% | - | 7% | 2% | 1% |
| Quinnipiac | November 11, 1999 | - | 2% | - | 56% | - | 8% | 2% | - | 1% | 17% | - | - |
| Quinnipiac | December 14, 1999 | - | 2% | - | 49% | - | 7% | 1% | - | 1% | 24% | - | - |
| Quinnipiac | January 19, 2000 | - | 1% | - | 47% | - | 5% | 2% | - | 2% | 28% | - | - |
| Quinnipiac | February 10, 2000 | - | - | - | 44% | - | 4% | - | - | 4% | 37% | - | - |
| Quinnipiac | March 1, 2000 | - | - | - | 40% | - | - | - | - | 4% | 47% | - | - |
| Quinnipiac | March 6, 2000 | - | - | - | 48% | - | - | - | - | 7% | 39% | - | - |
General election
Polling
| Source | Date | Al Gore (D) | George W. Bush (R) | Patrick Buchanan (Ref) | Ralph Nader (G) |
|---|---|---|---|---|---|
| Quinnipiac | February 24, 1999 | 49% | 40% | - | - |
| Quinnipiac | March 24, 1999 | 47% | 42% | - | - |
| Quinnipiac | July 1, 1999 | 44% | 45% | - | - |
| Quinnipiac | August 2, 1999 | 45% | 43% | - | - |
| Quinnipiac | September 15, 1999 | 46% | 43% | - | - |
| Quinnipiac | October 3, 1999 | 43% | 41% | - | - |
| Quinnipiac | November 11, 1999 | 47% | 43% | - | - |
| Quinnipiac | December 14, 1999 | 47% | 39% | - | - |
| Quinnipiac | January 19, 2000 | 47% | 39% | - | - |
| Quinnipiac | February 10, 2000 | 53% | 37% | - | - |
| Quinnipiac | March 1, 2000 | 53% | 36% | - | - |
| Quinnipiac | April 6, 2000 | 52% | 34% | 4% | - |
| Quinnipiac | May 2, 2000 | 50% | 34% | 4% | - |
| Quinnipiac | July 13, 2000 | 45% | 35% | 2% | 7% |
| Quinnipiac | August 10, 2000 | 42% | 38% | 1% | 6% |
| Quinnipiac | September 13, 2000 | 56% | 29% | 2% | 6% |
| Quinnipiac | September 28, 2000 | 54% | 34% | 1% | 6% |
| Quinnipiac | November 6, 2000 | 55% | 34% | 1% | 6% |
| Source | Date | Bill Bradley (D) | George W. Bush (R) |
|---|---|---|---|
| Quinnipiac | February 24, 1999 | 41% | 38% |
| Quinnipiac | March 24, 1999 | 45% | 39% |
| Quinnipiac | July 1, 1999 | 43% | 44% |
| Quinnipiac | August 2, 1999 | 46% | 39% |
| Quinnipiac | September 15, 1999 | 47% | 37% |
| Quinnipiac | October 3, 1999 | 51% | 32% |
| Quinnipiac | November 11, 1999 | 52% | 35% |
| Quinnipiac | December 14, 1999 | 50% | 35% |
| Quinnipiac | January 19, 2000 | 52% | 35% |
| Quinnipiac | February 10, 2000 | 53% | 34% |
| Quinnipiac | March 1, 2000 | 51% | 35% |
| Source | Date | Al Gore (D) | Elizabeth Dole (R) |
|---|---|---|---|
| Quinnipiac | February 24, 1999 | 50% | 37% |
| Quinnipiac | March 24, 1999 | 49% | 38% |
| Quinnipiac | July 1, 1999 | 50% | 37% |
| Source | Date | Bill Bradley (D) | Elizabeth Dole (R) |
|---|---|---|---|
| Quinnipiac | February 24, 1999 | 46% | 34% |
| Quinnipiac | March 24, 1999 | 47% | 35% |
| Quinnipiac | July 1, 1999 | 50% | 35% |
| Source | Date | Al Gore (D) | John McCain (R) |
|---|---|---|---|
| Quinnipiac | November 11, 1999 | 49% | 35% |
| Quinnipiac | December 14, 1999 | 45% | 39% |
| Quinnipiac | January 19, 2000 | 47% | 38% |
| Quinnipiac | February 10, 2000 | 46% | 42% |
| Quinnipiac | March 1, 2000 | 44% | 43% |
| Source | Date | Bill Bradley (D) | John McCain (R) |
|---|---|---|---|
| Quinnipiac | November 11, 1999 | 55% | 23% |
| Quinnipiac | December 14, 1999 | 48% | 29% |
| Quinnipiac | January 19, 2000 | 49% | 29% |
| Quinnipiac | February 10, 2000 | 43% | 40% |
| Quinnipiac | March 1, 2000 | 39% | 44% |
Results
| 2000 United States presidential election in New York[1] | ||||||
|---|---|---|---|---|---|---|
| Party | Candidate | Popular votes | Percentage | Electoral votes | ||
| Democratic | Al Gore | 3,942,215 | 57.78% | |||
| Working Families | Al Gore | 88,395 | 1.30% | |||
| Liberal | Al Gore | 77,087 | 1.13% | |||
| Total | Al Gore | 4,113,791 | 60.22% | 33 | ||
| Republican | George W. Bush | 2,258,577 | 33.10% | |||
| Conservative | George W. Bush | 144,797 | 2.12% | |||
| Total | George W. Bush | 2,405,676 | 35.22% | 0 | ||
| Green | Ralph Nader | 244,398 | 3.58% | 0 | ||
| Right to Life | Pat Buchanan | 25,175 | 0.37% | |||
| Reform | Pat Buchanan | 6,424 | 0.09% | |||
| Total | Pat Buchanan | 31,659 | 0.46% | 0 | ||
| Independence (a) | John Hagelin | 24,369 | 0.36% | 0 | ||
| Libertarian | Harry Browne | 7,718 | 0.11% | 0 | ||
| Constitution | Howard Phillips | 1,503 | 0.02% | 0 | ||
| Socialist Workers | James Harris | 1,450 | 0.02% | 0 | ||
| Others | - | 614 | 0.01% | 0 | ||
| - | Totals | 6,831,178 | 100% | 33 | ||
| Voter turnout (Voting age/Registered) | 48%/61% | |||||
(a) John Hagelin was then nominee of the Natural Law Party nationally.
Results breakdown
By congressional district
Gore won 27 of 31 congressional districts.[2]
| District | Bush | Gore | Representative |
|---|---|---|---|
| 1st | 43% | 53% | Michael Forbes |
| Felix Grucci | |||
| 2nd | 40% | 56% | Rick Lazio |
| Steve Israel | |||
| 3rd | 42% | 55% | Peter T. King |
| 4th | 38% | 59% | Carolyn McCarthy |
| 5th | 35% | 62% | Gary Ackerman |
| 6th | 11% | 88% | Gregory W. Meeks |
| 7th | 25% | 71% | Joseph Crowley |
| 8th | 17% | 77% | Jerrold Nadler |
| 9th | 29% | 68% | Anthony D. Weiner |
| 10th | 7% | 90% | Edolphus Towns |
| 11th | 7% | 89% | Major Owens |
| 12th | 13% | 81% | Nydia Velasquez |
| 13th | 44% | 53% | Vito Fossella |
| 14th | 23% | 71% | Carolyn B. Maloney |
| 15th | 6% | 90% | Charlie Rangel |
| 16th | 6% | 93% | Jose Serrano |
| 17th | 11% | 87% | Eliot L. Engel |
| 18th | 37% | 60% | Nita Lowey |
| 19th | 45% | 50% | Sue W. Kelly |
| 20th | 42% | 54% | Benjamin Gilman |
| 21st | 37% | 57% | Michael R. McNulty |
| 22nd | 50% | 44% | John E. Sweeney |
| 23rd | 50% | 45% | Sherwood Boehlert |
| 24th | 48% | 48% | John M. McHugh |
| 25th | 42% | 53% | James T. Walsh |
| 26th | 42% | 51% | Maurice Hinchey |
| 27th | 53% | 42% | Thomas M. Reynolds |
| 28th | 42% | 53% | Louise Slaughter |
| 29th | 43% | 52% | John J. LaFalce |
| 30th | 35% | 60% | Jack Quinn |
| 31st | 53% | 42% | Amo Houghton |
By county
| County | Gore% | Gore# | Bush% | Bush# | Others% | Others# | Total |
|---|---|---|---|---|---|---|---|
| Albany | 57.99% | 82,325 | 31.98% | 45,408 | 10.03% | 14,236 | 141,969 |
| Allegany | 32.69% | 6,109 | 58.41% | 10,916 | 8.90% | 1,664 | 18,689 |
| Bronx | 83.21% | 256,322 | 10.79% | 33,224 | 6.01% | 18,502 | 308,048 |
| Broome | 49.53% | 43,119 | 40.89% | 35,598 | 9.59% | 8,346 | 87,063 |
| Cattaraugus | 39.63% | 13,368 | 51.45% | 17,355 | 8.92% | 3,010 | 33,733 |
| Cayuga | 48.06% | 16,329 | 41.40% | 14,066 | 10.55% | 3,583 | 33,978 |
| Chautauqua | 44.35% | 26,045 | 46.61% | 27,369 | 9.04% | 5,306 | 58,720 |
| Chemung | 44.76% | 16,878 | 48.15% | 18,158 | 7.09% | 2,674 | 37,710 |
| Chenango | 43.24% | 8,756 | 47.53% | 9,625 | 9.23% | 1,869 | 20,250 |
| Clinton | 48.67% | 14,871 | 41.45% | 12,664 | 9.88% | 3,020 | 30,555 |
| Columbia | 44.82% | 12,858 | 42.12% | 12,084 | 13.07% | 3,749 | 28,691 |
| Cortland | 44.57% | 9,237 | 45.23% | 9,374 | 10.19% | 2,112 | 20,723 |
| Delaware | 40.01% | 8,072 | 50.33% | 10,154 | 9.66% | 1,949 | 20,175 |
| Dutchess | 45.18% | 50,499 | 44.03% | 49,210 | 10.78% | 12,053 | 111,762 |
| Erie | 53.68% | 227,975 | 35.15% | 149,280 | 11.16% | 47,399 | 424,654 |
| Essex | 42.08% | 7,546 | 47.27% | 8,476 | 10.65% | 1,910 | 17,932 |
| Franklin | 48.88% | 8,528 | 42.23% | 7,368 | 8.89% | 1,551 | 17,447 |
| Fulton | 41.66% | 9,028 | 50.59% | 10,964 | 7.75% | 1,679 | 21,671 |
| Genesee | 37.01% | 9,647 | 51.71% | 13,479 | 11.29% | 2,943 | 26,069 |
| Greene | 38.45% | 8,111 | 49.49% | 10,439 | 12.06% | 2,544 | 21,094 |
| Hamilton | 28.95% | 1,066 | 61.62% | 2,269 | 9.42% | 347 | 3,682 |
| Herkimer | 42.69% | 11,826 | 48.48% | 13,430 | 8.84% | 2,449 | 27,705 |
| Jefferson | 44.26% | 16,117 | 47.78% | 17,401 | 7.96% | 2,900 | 36,418 |
| Kings | 76.55% | 472,402 | 14.64% | 90,355 | 8.81% | 54,348 | 617,105 |
| Lewis | 37.94% | 4,144 | 53.47% | 5,840 | 8.60% | 939 | 10,923 |
| Livingston | 36.93% | 10,054 | 52.76% | 14,363 | 10.31% | 2,806 | 27,223 |
| Madison | 40.34% | 11,444 | 49.37% | 14,003 | 10.29% | 2,919 | 28,366 |
| Monroe | 49.51% | 157,314 | 41.23% | 131,002 | 9.27% | 29,446 | 317,762 |
| Montgomery | 47.52% | 9,888 | 44.26% | 9,210 | 8.22% | 1,711 | 20,809 |
| Nassau | 56.14% | 331,050 | 36.29% | 214,022 | 7.57% | 44,635 | 589,707 |
| New York | 75.94% | 427,714 | 13.73% | 77,331 | 10.33% | 58,187 | 563,232 |
| Niagara | 48.40% | 45,133 | 41.34% | 38,554 | 10.26% | 9,570 | 93,257 |
| Oneida | 44.02% | 42,253 | 46.87% | 44,993 | 9.11% | 8,750 | 95,996 |
| Onondaga | 51.45% | 104,766 | 38.56% | 78,526 | 9.99% | 20,337 | 203,629 |
| Ontario | 41.67% | 19,147 | 48.77% | 22,409 | 9.56% | 4,392 | 45,948 |
| Orange | 44.70% | 56,567 | 46.92% | 59,371 | 8.38% | 10,611 | 126,549 |
| Orleans | 36.31% | 5,753 | 54.78% | 8,679 | 8.91% | 1,411 | 15,843 |
| Oswego | 45.12% | 21,869 | 45.20% | 21,911 | 9.68% | 4,693 | 48,473 |
| Otsego | 43.28% | 10,976 | 46.13% | 11,697 | 10.59% | 2,685 | 25,358 |
| Putnam | 42.01% | 17,872 | 46.66% | 19,852 | 11.34% | 4,823 | 42,547 |
| Queens | 72.14% | 401,067 | 20.42% | 113,528 | 7.44% | 41,335 | 555,930 |
| Rensselaer | 48.48% | 33,178 | 39.78% | 27,223 | 11.74% | 8,035 | 68,436 |
| Richmond | 49.90% | 70,922 | 41.65% | 59,187 | 8.45% | 12,012 | 142,121 |
| Rockland | 54.33% | 66,596 | 36.68% | 44,958 | 8.99% | 11,026 | 122,580 |
| Saratoga | 43.76% | 41,596 | 46.60% | 44,292 | 9.65% | 9,169 | 95,057 |
| Schenectady | 51.16% | 34,250 | 39.08% | 26,161 | 9.76% | 6,535 | 66,946 |
| Schoharie | 38.22% | 5,178 | 51.93% | 7,035 | 9.85% | 1,335 | 13,548 |
| Schuyler | 38.42% | 3,132 | 50.95% | 4,154 | 10.63% | 867 | 8,153 |
| Seneca | 45.89% | 6,578 | 44.49% | 6,377 | 9.61% | 1,378 | 14,333 |
| St. Lawrence | 51.95% | 20,664 | 39.71% | 15,797 | 8.34% | 3,318 | 39,779 |
| Steuben | 34.55% | 14,014 | 57.30% | 23,244 | 8.15% | 3,305 | 40,563 |
| Suffolk | 51.56% | 295,902 | 39.32% | 225,652 | 9.12% | 52,312 | 573,866 |
| Sullivan | 48.71% | 13,895 | 41.57% | 11,858 | 9.71% | 2,771 | 28,524 |
| Tioga | 39.36% | 8,838 | 52.65% | 11,823 | 7.99% | 1,793 | 22,454 |
| Tompkins | 51.01% | 20,435 | 32.35% | 12,957 | 16.64% | 6,666 | 40,058 |
| Ulster | 46.43% | 36,321 | 39.65% | 31,015 | 13.92% | 10,889 | 78,225 |
| Warren | 40.73% | 11,656 | 49.81% | 14,257 | 9.46% | 2,708 | 28,621 |
| Washington | 39.22% | 9,238 | 50.79% | 11,963 | 9.99% | 2,354 | 23,555 |
| Wayne | 37.62% | 14,421 | 52.53% | 20,136 | 9.84% | 3,772 | 38,329 |
| Westchester | 56.96% | 211,771 | 35.24% | 130,999 | 7.80% | 29,005 | 371,775 |
| Wyoming | 32.69% | 5,762 | 58.12% | 10,245 | 9.19% | 1,620 | 17,627 |
| Yates | 38.03% | 3,823 | 52.60% | 5,287 | 9.37% | 942 | 10,052 |
Geographic Breakdown
Al Gore won an overwhelming landslide in fiercely Democratic New York City, taking 1,703,364 votes to George W. Bush's 398,726, a 77.90% - 18.23% victory. Gore carried all 5 boroughs of New York City.
Excluding New York City's votes, Gore still would have carried New York State, but by a smaller margin, receiving 2,404,543 votes to Bush's 2,004,648, giving Gore a 54.53% - 45.47% win.
Electors
Technically the voters of New York cast their ballots for electors: representatives to the Electoral College. New York is allocated 33 electors because it has 31 congressional districts and 2 senators. All candidates who appear on the ballot or qualify to receive write-in votes must submit a list of 33 electors, who pledge to vote for their candidate and his or her running mate. Whoever wins the majority of votes in the state is awarded all 33 electoral votes. Their chosen electors then vote for president and vice president. Although electors are pledged to their candidate and running mate, they are not obligated to vote for them. An elector who votes for someone other than his or her candidate is known as a faithless elector.
The electors of each state and the District of Columbia met on December 18, 2000[3] to cast their votes for president and vice president. The Electoral College itself never meets as one body. Instead the electors from each state and the District of Columbia met in their respective capitols.
The following were the members of the Electoral College from the state. All were pledged to and voted for Gore and Lieberman:[4]
- Susan I. Abramowitz
- Leslie Alpert
- Martin S. Begun
- David L. Cohen
- Carolee A. Conklin
- Martin Connor
- Lorraine Cortez Vasquez
- Inez E. Dickens
- Cynthia Emmer
- Herman D. Farrell Jr.
- Emily Giske
- Patrick G. Halpin
- Raymond B. Harding
- Judith Hope
- Denis M. Hughes
- Virginia Kee
- Bertha Lewis
- Alberta Madonna
- Thomas J. Manton
- Deborah Marciano
- Helen Marshall
- Carl McCall
- Elizabeth F. Momrow
- Clarence Norman Jr.
- Daniel F. Donohue
- Shirley O'Connell
- G. Steven Pigeon
- Roberto Ramirez
- Michael Schell
- Sheldon Silver
- Andrew Spano
- Eliot Spitzer
- Randi Weingarten
References
- "Dave Leip's Atlas of U.S. Presidential Elections 2000 - New York". Retrieved 2013-01-07.
- https://uselectionatlas.org/RESULTS/data.php?year=2000&fips=36&f=0&off=0&elect=0&datatype=cd&def=1
- "2000 Post-Election Timeline of Events". www.uselectionatlas.org. Retrieved 9 April 2018.
- "President Elect - 2000". presidentelect.org. Archived from the original on 12 February 2012. Retrieved 9 April 2018.