2000 United States presidential election in Illinois
The 2000 United States presidential election in Illinois took place on November 7, 2000, and was part of the 2000 United States presidential election. Voters chose 22 representatives, or electors to the Electoral College, who voted for president and vice president.
| ||||||||||||||||||||||||||
| Turnout | 66.52% | |||||||||||||||||||||||||
|---|---|---|---|---|---|---|---|---|---|---|---|---|---|---|---|---|---|---|---|---|---|---|---|---|---|---|
| ||||||||||||||||||||||||||
 County Results
| ||||||||||||||||||||||||||
| ||||||||||||||||||||||||||
| Elections in Illinois | ||||||||||
|---|---|---|---|---|---|---|---|---|---|---|
 | ||||||||||
|
||||||||||
|
||||||||||
|
||||||||||
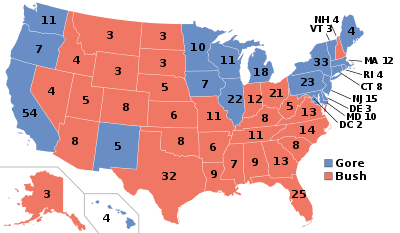
Illinois was easily won by sitting Vice President Al Gore by a safe margin of victory, unlike other states in the Midwest, such as nearby Iowa, Minnesota and Wisconsin, which Gore won, albeit by very small margins. Bush did not perform terribly at the county level, as he obtained less than forty percent of the vote in only three counties. Gore's key to victory was Cook County, home of Chicago, by far the most populous county in the state and one of the most populated counties in the nation. Gore won that county with almost seventy percent of the vote, his best performance in any county in the state.[1] Bush was the first Republican to win the White House without carrying either Illinois or Vermont, and was also the first time since 1976 that Illinois did not vote for the winning candidate in a presidential election.
Election information
The primaries and general elections coincided with those for congress and those for state offices.
Primaries
Democratic
| |||||||||||||||||||
190 Democratic National Convention delegates (161 pledged, 29 unpledged) The number of pledged delegates received is determined by the popular vote | |||||||||||||||||||
|---|---|---|---|---|---|---|---|---|---|---|---|---|---|---|---|---|---|---|---|
| |||||||||||||||||||
.jpg)
_(1).jpg)
The 2000 Illinois Democratic presidential presidential primary was held on March 21, 2000 in the U.S. state of Illinois as one of the Democratic Party's statewide nomination contests ahead of the 2000 presidential election.[4]
161 of the state's 190 delegates were pledged delegates elected in the primary (the remaining 29 delegates were superdelegates).[4] Of the 161 pledged delegates, 35 were elected based upon the statewide popular vote, with the remaining 126 being elected based upon congressional district popular votes.[4] In order to receive delegates from either the popular vote of either the state at-large of the popular vote of a congressional district, a candidate needed to reach the threshold of 15% or more of said vote.[4]
| Candidate | Votes | % | Delegates |
|---|---|---|---|
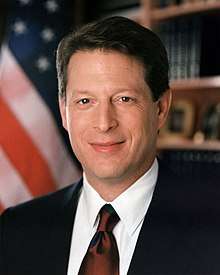
| Al Gore | 682,932 | 84.35 | 149 |
| Bill Bradley withdrew | 115,320 | 14.24 | 12 |
| Lyndon LaRouche | 11,415 | 1.41 | 0 |
| Total | 809,667 | 100% | 161 |
Republican
| |||||||||||||||||||||||||
74 Republican National Convention delegates (64 pledged, 10 unpledged) Pledged delegates directly-elected in vote separate from statewide presidential preference vote | |||||||||||||||||||||||||
|---|---|---|---|---|---|---|---|---|---|---|---|---|---|---|---|---|---|---|---|---|---|---|---|---|---|
| |||||||||||||||||||||||||
.jpg)
.jpg)
.jpg)
The 2000 Illinois Republican presidential primary was held on March 21, 2000 in the U.S. state of Illinois as one of the Republican Party's statewide nomination contests ahead of the 2000 presidential election.[5]
Illinois assigned 60 directly-elected delegates (the state had another 10 delegates that were not directly elected by voters).[5] The Illinois primary was a so-called "Loophole" primary. This meant that the statewide presidential preference vote was a "beauty contest", from which no delegates would be assigned. Instead, the delegates were assigned by separate direct-votes on delegate candidates (whose proclaimed presidential preferences were listed beside their names on the ballot).[5] These delegates were noted voted on at-large by a state vote, but rather by congressional district votes.[5] The number of delegates each congressional district would be able to elect had been decided based upon the strength of that district's vote for the Republican nominee (Bob Dole) in the previous 1996 election.[5]
The remaining ten delegates not directly elected by congressional district were selected at the Illinois Republican Party Convention, and were unpledged delegates.[5]
| Candidate | Votes | % | Delegates |
|---|---|---|---|
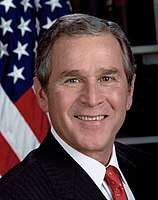
| George W. Bush | 496,685 | 67.40 | 64 |
| John McCain withdrawn | 158,768 | 21.54 | 0 |
| Alan Keyes | 66,066 | 8.97 | 0 |
| Steve Forbes withdrawn | 10,334 | 1.40 | 0 |
| Gary Bauer withdrawn | 5,068 | 0.69 | 0 |
| Total | 736,921 | 100% | 64 |
General election
Vice President Al Gore easily defeated Texas Governor George W. Bush in the “Land of Lincoln”. Illinois was once reckoned as a swing state or slightly Republican leaning, but since Bill Clinton's election in 1992 it swung heavily for the Democrats at the presidential level. The trend of blue in the state can be traced to Cook County, which encompasses the Chicago Metropolitan Area, and the gradual trend toward Democrats in the socially liberal suburban regions, known as the "collar counties". The Chicago metro area is not only heavily populated, but also extremely Democratic. Bush did do well in rural areas of Illinois, and also won in Springfield and the Chicago collar counties, Will, Lake, and DuPage. The closest collar county was Lake County which gave a narrow edge for Bush. Ultimately though, Gore's huge numbers out of Cook County, home of Chicago, overwhelmed Bush. Gore also did well in the East St. Louis Area. Statewide, Gore ultimately received 2,589,026 votes to Bush's 2,019,421. Gore ended up with around a 12-point margin of victory. Illinois was among the first Midwest states to be called on election night. As of the 2016 presidential election, this is the last election in which Franklin County and Perry County voted for a Democratic presidential candidate.[6]
| 2000 United States presidential election in Illinois | ||||||
|---|---|---|---|---|---|---|
| Party | Candidate | Running mate | Votes | Percentage | Electoral votes | |
| Democratic | Albert Arnold Gore | Joseph Isadore Lieberman | 2,589,026 | 54.6% | 22 | |
| Republican | George Walker Bush | Richard Bruce Cheney | 2,019,421 | 42.6% | 0 | |
| Green | Ralph Nader | Winona LaDuke | 103,759 | 2.2% | 0 | |
| Reform | Pat Buchanan | Ezola Foster | 16,106 | 0.3% | 0 | |
| Libertarian | Harry Browne | Wayne Allyn Root | 11,623 | 0.3% | 0 | |
| Natural Law | John Hagelin | Mary Alice Herbert | 2,127 | 0.0% | 0 | |
| Constitution | Howard Phillips | Michael Peroutka | 57 | 0.0% | 0 | |
| Write In | David McReynolds | - | 4 | 0.0% | 0 | |
| Totals | 4,742,123 | 100.00% | 3 | |||
| Voter turnout (Voting age/Registered) | 52%/67% | |||||
Results by county
| County | Albert Arnold Gore Junior Democratic |
George Walker Bush Republican |
Ralph Nader Green |
Various candidates Other parties |
Margin | Total votes cast | |||||
|---|---|---|---|---|---|---|---|---|---|---|---|
| # | % | # | % | # | % | # | % | # | % | ||
| Adams | 12,197 | 40.51% | 17,331 | 57.56% | 371 | 1.23% | 210 | 0.70% | -5,134 | -17.05% | 30,109 |
| Alexander | 2,357 | 58.60% | 1,588 | 39.48% | 28 | 0.70% | 49 | 1.22% | 769 | 19.12% | 4,022 |
| Bond | 3,060 | 43.52% | 3,804 | 54.10% | 113 | 1.61% | 55 | 0.78% | -744 | -10.58% | 7,032 |
| Boone | 6,481 | 41.75% | 8,617 | 55.51% | 325 | 2.09% | 100 | 0.64% | -2,136 | -13.76% | 15,523 |
| Brown | 1,077 | 40.49% | 1,529 | 57.48% | 29 | 1.09% | 25 | 0.94% | -452 | -16.99% | 2,660 |
| Bureau | 7,754 | 46.09% | 8,526 | 50.68% | 363 | 2.16% | 180 | 1.07% | -772 | -4.59% | 16,823 |
| Calhoun | 1,310 | 50.35% | 1,229 | 47.23% | 42 | 1.61% | 21 | 0.81% | 81 | 3.12% | 2,602 |
| Carroll | 3,113 | 43.37% | 3,835 | 53.43% | 154 | 2.15% | 75 | 1.05% | -722 | -10.06% | 7,177 |
| Cass | 2,789 | 47.28% | 2,968 | 50.31% | 94 | 1.59% | 48 | 0.81% | -179 | -3.03% | 5,899 |
| Champaign | 35,515 | 47.81% | 34,645 | 46.64% | 3,543 | 4.77% | 582 | 0.78% | 870 | 1.17% | 74,285 |
| Christian | 6,799 | 46.03% | 7,537 | 51.03% | 269 | 1.82% | 166 | 1.12% | -738 | -5.00% | 14,771 |
| Clark | 2,932 | 39.03% | 4,398 | 58.55% | 126 | 1.68% | 56 | 0.75% | -1,466 | -19.52% | 7,512 |
| Clay | 2,212 | 36.06% | 3,789 | 61.76% | 78 | 1.27% | 56 | 0.91% | -1,577 | -25.70% | 6,135 |
| Clinton | 6,436 | 41.72% | 8,588 | 55.67% | 295 | 1.91% | 108 | 0.70% | -2,152 | -13.95% | 15,427 |
| Coles | 8,904 | 44.31% | 10,495 | 52.23% | 507 | 2.52% | 187 | 0.93% | -1,591 | -7.92% | 20,093 |
| Cook | 1,280,547 | 68.63% | 534,542 | 28.65% | 42,068 | 2.25% | 8,750 | 0.47% | 746,005 | 39.98% | 1,865,907 |
| Crawford | 3,333 | 39.21% | 4,974 | 58.52% | 118 | 1.39% | 75 | 0.88% | -1,641 | -19.31% | 8,500 |
| Cumberland | 1,870 | 37.59% | 2,964 | 59.58% | 72 | 1.45% | 69 | 1.39% | -1,094 | -21.99% | 4,975 |
| DeKalb | 14,798 | 44.53% | 17,139 | 51.57% | 1,032 | 3.11% | 264 | 0.79% | -2,341 | -7.04% | 33,233 |
| DeWitt | 2,870 | 40.70% | 3,968 | 56.28% | 133 | 1.89% | 80 | 1.13% | -1,098 | -15.58% | 7,051 |
| Douglas | 3,215 | 39.44% | 4,734 | 58.07% | 132 | 1.62% | 71 | 0.87% | -1,519 | -18.63% | 8,152 |
| DuPage | 152,550 | 41.87% | 201,037 | 55.18% | 8,711 | 2.39% | 2,064 | 0.57% | -48,487 | -13.31% | 364,362 |
| Edgar | 3,216 | 39.07% | 4,833 | 58.71% | 113 | 1.37% | 70 | 0.85% | -1,617 | -19.64% | 8,232 |
| Edwards | 978 | 30.00% | 2,212 | 67.85% | 42 | 1.29% | 28 | 0.86% | -1,234 | -37.85% | 3,260 |
| Effingham | 4,225 | 29.17% | 9,855 | 68.04% | 213 | 1.47% | 192 | 1.33% | -5,630 | -38.87% | 14,485 |
| Fayette | 3,886 | 41.61% | 5,200 | 55.69% | 122 | 1.31% | 130 | 1.39% | -1,314 | -14.08% | 9,338 |
| Ford | 2,090 | 33.97% | 3,889 | 63.20% | 116 | 1.89% | 58 | 0.94% | -1,799 | -29.23% | 6,153 |
| Franklin | 10,201 | 53.10% | 8,490 | 44.19% | 347 | 1.81% | 174 | 0.91% | 1,711 | 8.91% | 19,212 |
| Fulton | 8,940 | 54.92% | 6,936 | 42.61% | 276 | 1.70% | 125 | 0.77% | 2,004 | 12.31% | 16,277 |
| Gallatin | 1,878 | 52.78% | 1,591 | 44.72% | 40 | 1.12% | 49 | 1.38% | 287 | 8.06% | 3,558 |
| Greene | 2,490 | 43.18% | 3,129 | 54.26% | 93 | 1.61% | 55 | 0.95% | -639 | -11.08% | 5,767 |
| Grundy | 7,516 | 45.32% | 8,709 | 52.51% | 257 | 1.55% | 102 | 0.62% | -1,193 | -7.19% | 16,584 |
| Hamilton | 1,943 | 42.36% | 2,519 | 54.92% | 75 | 1.64% | 50 | 1.09% | -576 | -12.56% | 4,587 |
| Hancock | 4,256 | 43.92% | 5,134 | 52.98% | 166 | 1.66% | 140 | 1.44% | -878 | -9.06% | 9,696 |
| Hardin | 1,184 | 44.90% | 1,366 | 51.80% | 41 | 1.55% | 46 | 1.74% | -182 | -6.90% | 2,637 |
| Henderson | 2,030 | 52.51% | 1,708 | 44.18% | 74 | 1.91% | 54 | 1.40% | 322 | 8.33% | 3,866 |
| Henry | 11,921 | 50.79% | 10,896 | 46.43% | 428 | 1.82% | 225 | 0.96% | 1,025 | 4.36% | 23,470 |
| Iroquois | 4,397 | 32.75% | 8,685 | 64.70% | 229 | 1.71% | 113 | 0.84% | -4,288 | -31.95% | 13,424 |
| Jackson | 11,773 | 50.99% | 9,823 | 42.54% | 1,228 | 5.32% | 266 | 1.15% | 1,950 | 8.45% | 23,090 |
| Jasper | 1,815 | 36.15% | 3,119 | 62.12% | 50 | 1.00% | 37 | 0.74% | -1,304 | -25.97% | 5,021 |
| Jefferson | 6,685 | 43.52% | 8,362 | 54.44% | 211 | 1.37% | 102 | 0.66% | -1,677 | -10.92% | 15,360 |
| Jersey | 4,355 | 46.27% | 4,699 | 49.92% | 231 | 2.45% | 128 | 1.36% | -344 | -3.65% | 9,413 |
| Jo Daviess | 4,585 | 44.42% | 5,304 | 51.39% | 314 | 3.04% | 119 | 1.15% | -719 | -6.97% | 10,322 |
| Johnson | 1,928 | 35.96% | 3,285 | 61.26% | 83 | 1.55% | 66 | 1.23% | -1,357 | -25.30% | 5,362 |
| Kane | 60,127 | 42.52% | 76,996 | 54.45% | 3,274 | 2.32% | 1,008 | 0.71% | -16,869 | -11.93% | 141,405 |
| Kankakee | 19,180 | 47.73% | 20,049 | 49.89% | 713 | 1.77% | 241 | 0.60% | -869 | -2.16% | 40,183 |
| Kendall | 8,444 | 37.09% | 13,688 | 60.12% | 481 | 2.11% | 156 | 0.69% | -5,244 | -23.03% | 22,769 |
| Knox | 12,572 | 54.25% | 9,912 | 42.77% | 455 | 1.96% | 235 | 1.01% | 2,660 | 11.48% | 23,174 |
| Lake | 115,058 | 47.51% | 120,988 | 49.96% | 4,843 | 2.00% | 1,275 | 0.53% | -5,930 | -2.45% | 242,164 |
| LaSalle | 23,355 | 50.76% | 21,276 | 46.25% | 992 | 2.16% | 384 | 0.83% | 2,079 | 4.51% | 46,007 |
| Lawrence | 2,822 | 42.90% | 3,594 | 54.64% | 101 | 1.54% | 61 | 0.93% | -772 | -11.74% | 6,578 |
| Lee | 6,111 | 41.80% | 8,069 | 55.19% | 320 | 2.19% | 120 | 0.82% | -1,958 | -13.39% | 14,620 |
| Livingston | 5,829 | 37.80% | 9,187 | 59.57% | 285 | 1.85% | 120 | 0.78% | -3,358 | -21.77% | 15,421 |
| Logan | 4,600 | 35.21% | 8,141 | 62.31% | 208 | 1.59% | 116 | 0.89% | -3,541 | -27.10% | 13,065 |
| Macon | 24,262 | 49.02% | 23,830 | 48.14% | 982 | 1.98% | 425 | 0.86% | 432 | 0.88% | 49,499 |
| Macoupin | 11,015 | 51.50% | 9,749 | 45.58% | 426 | 1.99% | 199 | 0.93% | 1,266 | 5.92% | 21,389 |
| Madison | 59,077 | 53.17% | 48,821 | 43.94% | 2,359 | 2.12% | 847 | 0.76% | 10,256 | 9.23% | 111,104 |
| Marion | 8,068 | 48.42% | 8,240 | 49.45% | 238 | 1.43% | 117 | 0.70% | -172 | -1.03% | 16,663 |
| Marshall | 2,570 | 43.51% | 3,145 | 53.24% | 134 | 2.27% | 58 | 0.98% | -575 | -9.73% | 5,907 |
| Mason | 3,192 | 47.14% | 3,411 | 50.37% | 117 | 1.73% | 52 | 0.77% | -219 | -3.23% | 6,772 |
| Massac | 2,912 | 43.18% | 3,676 | 54.51% | 83 | 1.23% | 73 | 1.08% | -764 | -11.33% | 6,744 |
| McDonough | 6,080 | 46.73% | 6,465 | 49.68% | 364 | 2.80% | 103 | 0.79% | -385 | -2.95% | 13,012 |
| McHenry | 40,698 | 38.33% | 62,112 | 58.49% | 2,751 | 2.59% | 624 | 0.59% | -21,414 | -20.16% | 106,185 |
| McLean | 24,936 | 40.95% | 34,008 | 55.84% | 1,546 | 2.54% | 408 | 0.67% | -9,072 | -14.89% | 60,898 |
| Menard | 2,164 | 34.89% | 3,862 | 62.27% | 135 | 2.18% | 41 | 0.66% | -1,698 | -27.38% | 6,202 |
| Mercer | 4,400 | 52.90% | 3,688 | 44.34% | 156 | 1.88% | 74 | 0.89% | 712 | 8.56% | 8,318 |
| Monroe | 5,797 | 42.02% | 7,632 | 55.32% | 262 | 1.90% | 105 | 0.76% | -1,835 | -13.30% | 13,796 |
| Montgomery | 6,542 | 49.97% | 6,226 | 47.55% | 191 | 1.46% | 134 | 1.02% | 316 | 2.42% | 13,093 |
| Morgan | 5,899 | 41.15% | 8,058 | 56.22% | 253 | 1.77% | 124 | 0.87% | -2,159 | -15.07% | 14,334 |
| Moultrie | 2,529 | 44.17% | 3,058 | 53.41% | 78 | 1.36% | 60 | 1.05% | -529 | -9.24% | 5,725 |
| Ogle | 7,673 | 37.25% | 12,325 | 59.83% | 467 | 2.27% | 136 | 0.66% | -4,652 | -22.58% | 20,601 |
| Peoria | 38,604 | 50.26% | 36,398 | 47.39% | 1,332 | 1.73% | 478 | 0.62% | 2,206 | 2.87% | 76,812 |
| Perry | 4,862 | 48.90% | 4,802 | 48.30% | 173 | 1.74% | 105 | 1.06% | 60 | 0.60% | 9,942 |
| Piatt | 3,488 | 41.60% | 4,619 | 55.09% | 217 | 2.59% | 61 | 0.73% | -1,131 | -13.49% | 8,385 |
| Pike | 3,198 | 39.42% | 4,706 | 58.01% | 115 | 1.42% | 93 | 1.15% | -1,508 | -18.59% | 8,112 |
| Pope | 927 | 39.79% | 1,346 | 57.77% | 31 | 1.33% | 26 | 1.12% | -419 | -17.98% | 2,330 |
| Pulaski | 1,518 | 50.33% | 1,430 | 47.41% | 31 | 1.03% | 37 | 1.23% | 88 | 2.92% | 3,016 |
| Putnam | 1,657 | 52.12% | 1,437 | 45.20% | 58 | 1.82% | 27 | 0.85% | 220 | 6.92% | 3,179 |
| Randolph | 6,794 | 47.55% | 7,127 | 49.88% | 229 | 1.60% | 137 | 0.96% | -333 | -2.33% | 14,287 |
| Richland | 2,491 | 33.54% | 4,718 | 63.52% | 134 | 1.80% | 85 | 1.14% | -2,227 | -29.98% | 7,428 |
| Rock Island | 37,957 | 58.31% | 25,194 | 38.70% | 1,364 | 2.10% | 580 | 0.89% | 12,763 | 19.61% | 65,095 |
| Saline | 5,427 | 46.58% | 5,933 | 50.93% | 181 | 1.55% | 109 | 0.94% | -506 | -4.35% | 11,650 |
| Sangamon | 38,414 | 41.99% | 50,374 | 55.06% | 2,001 | 2.19% | 696 | 0.76% | -11,960 | -13.07% | 91,485 |
| Schuyler | 1,587 | 42.07% | 2,077 | 55.06% | 72 | 1.91% | 36 | 0.95% | -490 | -12.99% | 3,772 |
| Scott | 954 | 38.64% | 1,458 | 59.05% | 31 | 1.26% | 26 | 1.05% | -504 | -20.41% | 2,469 |
| Shelby | 4,018 | 39.54% | 5,851 | 57.57% | 162 | 1.59% | 132 | 1.30% | -1,833 | -18.03% | 10,163 |
| St. Clair | 55,961 | 55.74% | 42,299 | 42.13% | 1,569 | 1.56% | 564 | 0.56% | 13,662 | 13.61% | 100,393 |
| Stark | 1,211 | 40.52% | 1,694 | 56.67% | 55 | 1.84% | 29 | 0.97% | -483 | -16.15% | 2,989 |
| Stephenson | 8,062 | 41.60% | 10,715 | 55.29% | 476 | 2.46% | 125 | 0.65% | -2,653 | -13.69% | 19,378 |
| Tazewell | 25,379 | 43.50% | 31,537 | 54.05% | 1,022 | 1.75% | 410 | 0.70% | -6,158 | -10.55% | 58,348 |
| Union | 3,982 | 45.98% | 4,397 | 50.77% | 189 | 2.18% | 92 | 1.06% | -415 | -4.79% | 8,660 |
| Vermilion | 15,406 | 47.99% | 15,783 | 49.17% | 605 | 1.88% | 306 | 0.95% | -377 | -1.18% | 32,100 |
| Wabash | 1,987 | 36.07% | 3,406 | 61.84% | 75 | 1.36% | 40 | 0.73% | -1,419 | -25.77% | 5,508 |
| Warren | 3,524 | 46.18% | 3,899 | 51.09% | 130 | 1.70% | 78 | 1.02% | -375 | -4.91% | 7,631 |
| Washington | 2,638 | 36.96% | 4,353 | 60.98% | 96 | 1.34% | 51 | 0.71% | -1,715 | -24.02% | 7,138 |
| Wayne | 2,209 | 28.71% | 5,347 | 69.50% | 77 | 1.00% | 60 | 0.78% | -3,138 | -40.79% | 7,693 |
| White | 2,958 | 38.73% | 4,521 | 59.20% | 113 | 1.48% | 45 | 0.59% | -1,563 | -20.47% | 7,637 |
| Whiteside | 12,886 | 51.88% | 11,252 | 45.30% | 515 | 2.07% | 184 | 0.74% | 1,634 | 6.58% | 24,837 |
| Will | 90,902 | 47.43% | 95,828 | 50.00% | 3,769 | 1.97% | 1,171 | 0.61% | -4,926 | -2.57% | 191,670 |
| Williamson | 12,192 | 45.26% | 14,012 | 52.01% | 476 | 1.77% | 259 | 0.96% | -1,820 | -6.75% | 26,939 |
| Winnebago | 51,981 | 47.56% | 53,816 | 49.24% | 2,637 | 2.41% | 863 | 0.79% | -1,835 | -1.68% | 109,297 |
| Woodford | 5,529 | 32.92% | 10,905 | 64.94% | 263 | 1.57% | 96 | 0.57% | -5,376 | -32.02% | 16,793 |
| Totals | 2,589,026 | 54.60% | 2,019,421 | 42.58% | 103,764 | 2.19% | 29,917 | 0.63% | 569,605 | 12.01% | 4,742,128 |
By congressional district
Gore won eleven of twenty congressional districts, including two that elected Republicans.[7]
| District | Gore | Bush | Representative |
|---|---|---|---|
| 1st | 87% | 11% | Bobby Rush |
| 2nd | 88% | 11% | Jesse Jackson Jr. |
| 3rd | 55% | 41% | Bill Lipinski |
| 4th | 78% | 18% | Luis Gutierrez |
| 5th | 63% | 33% | Rod Blagojevich |
| 6th | 45% | 52% | Henry Hyde |
| 7th | 83% | 15% | Danny K. Davis |
| 8th | 42% | 56% | Phil Crane |
| 9th | 70% | 26% | Jan Schakowsky |
| 10th | 53% | 45% | John Porter |
| Mark Kirk | |||
| 11th | 53% | 45% | Jerry Weller |
| 12th | 55% | 43% | Jerry Costello |
| 13th | 42% | 55% | Judy Biggert |
| 14th | 42% | 55% | Dennis Hastert |
| 15th | 44% | 52% | Thomas W. Ewing |
| Timothy V. Johnson | |||
| 16th | 43% | 54% | Donald Manzullo |
| 17th | 51% | 46% | Lane Evans |
| 18th | 43% | 55% | Ray LaHood |
| 19th | 43% | 54% | David D. Phelps |
| 20th | 46% | 52% | John Shimkus |
Electors
Technically the voters of Illinois cast their ballots for electors: representatives to the Electoral College. For this election, Illinois is allocated 22 electors because it has 20 congressional districts and two senators. All candidates who appear on the ballot or qualify to receive write-in votes must submit a list of 22 electors, who pledge to vote for their candidate and his or her running mate. Whoever wins the majority of votes in the state is awarded all 22 electoral votes. Their chosen electors then vote for president and vice president. Although electors are pledged to their candidate and running mate, they are not obligated to vote for them. An elector who votes for someone other than his or her candidate is known as a faithless elector.
The electors of each state and the District of Columbia met on December 18, 2000[8] to cast their votes for president and vice president. The Electoral College itself never meets as one body. Instead the electors from each state and the District of Columbia met in their respective capitols.
The following were the members of the Electoral College from the state. All were pledged to and voted for Gore and Lieberman:[9]
- Joan Brennan
- Dave Bybee
- Vilma Colom
- Barbara Flynn Currie
- John P. Daley
- Vera Davis
- James DeLeo
- Marge Friedman
- Charles A. Hartke
- Tinker Harvey
- Carolyn Brown Hodge
- Constance A. Howard
- Mary Lou Kearns
- Michael J. Madigan
- William Marovitz
- Shirley McCombs
- Molly McKenzie
- Victory McNamara
- John Nelson
- Donald Pedro
- Dan Pierce
- Jerry Sinclair
References
- http://uselectionatlas.org/RESULTS/
- "Voter Turnout". www.elections.il.gov. Illinois State Board of Elections. Retrieved 24 March 2020.
- "Election Results". www.elections.il.gov. Illinois State Board of Elections. Retrieved 24 March 2020.
- "Illinois Democrat Delegation 2000". www.thegreenpapers.com. The Green Papers. Retrieved 24 March 2020.
- "Illinois Republican Delegation 2000". www.thegreenpapers.com. The Green Papers. Retrieved 24 March 2020.
- Sullivan, Robert David; ‘How the Red and Blue Map Evolved Over the Past Century’; America Magazine in The National Catholic Review; June 29, 2016
- https://uselectionatlas.org/RESULTS/data.php?year=2000&fips=17&f=0&off=0&elect=0&datatype=cd&def=1
- http://www.uselectionatlas.org/INFORMATION/ARTICLES/pe2000timeline.php
- "Archived copy". Archived from the original on 2012-02-12. Retrieved 2009-10-25.CS1 maint: archived copy as title (link)