Virginia's 2nd congressional district
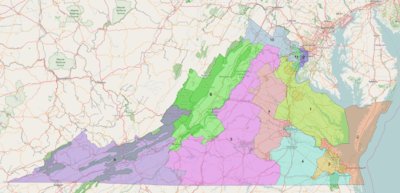
Virginia's second congressional district is a U.S. congressional district in the Commonwealth of Virginia. It currently encompasses all of Accomack, Northampton and York counties, all of the cities of Virginia Beach and Williamsburg and parts of the cities of Norfolk and Hampton, although its boundaries changed greatly over the centuries (it initially encompassed what became West Virginia after the American Civil War). Republican Scott Rigell defeated Democrat Glenn Nye in the November 2, 2010 election, and took his seat January 3, 2011 until 2017, when he was succeeded by Scott Taylor. In the November 6, 2018 election, Democrat Elaine Luria defeated Republican Scott Taylor. It is now considered one of Virginia's most competitive congressional districts.
| Virginia's 2nd congressional district | |||
|---|---|---|---|
| Representative |
| ||
| Distribution |
| ||
| Population (2016) | 745,816[2] | ||
| Median income | $70,500[3] | ||
| Ethnicity |
| ||
| Cook PVI | R+3[4] | ||
2016 redistricting
The Virginia Legislature's 2012 redistricting of the adjacent 3rd district was found unconstitutional and replaced with a court-ordered redistricting on January 16, 2016 for the 2016 elections.[5][6][7][8][9]
Recent results in statewide races
| Year | Office | Results |
|---|---|---|
| 1996 | U.S. President | Dole 48%–44%[10] |
| U.S. Senator | Warner 57%–43%[10] | |
| 1997 | Governor | Gilmore 56%–42%[11] |
| Lieutenant Governor | Hager 52%–41%[11] | |
| Attorney General | Earley 63%–37%[11] | |
| 2000 | U.S. President | Bush 53%–45%[12] |
| U.S. Senator | Allen 51%–49%[12] | |
| 2001 | Governor | Earley 50%–50%[13] |
| Lieutenant Governor | Katzen 52%–47%[13] | |
| Attorney General | Kilgore 64%–36%[13] | |
| 2002 | U.S. Senator | Warner 84%–9%[14] |
| 2004 | U.S. President | Bush 58%–42%[15] |
| 2005 | Governor | Kaine 50%–47%[16] |
| Lieutenant Governor | Bolling 54%–45%[16] | |
| Attorney General | McDonnell 55%–44%[16] | |
| 2006 | Senate | Allen 51%–48%[17] |
| 2008 | U.S. President | Obama 50%–48%[18] |
| Senate | Warner 65%–34%[18] | |
| 2009 | Governor | McDonnell 62%–38%[19] |
| Lieutenant Governor | Bolling 56%–44%[20] | |
| Attorney General | Cuccinelli 60%–40%[20] | |
| 2012 | U.S. President | Obama 50%–48%[21] |
| Senate | Kaine 52%–48%[21] | |
| 2013 | Governor | McAuliffe 47%–46%–7%[22] |
| Lieutenant Governor | Northam 57%–43%[23] | |
| Attorney General | Obenshain 52%–48%[24] | |
| 2014 | Senator | Gillespie 49%–48%[25] |
| 2016 | U.S. President | Trump 48%–45%[26] |
| 2017 | Governor | Northam 51%–47%[27] |
| 2018 | Senator | Kaine 54%–44%[28] |
List of members representing the district
| Representative | Party | Years | Cong ress |
Electoral history |
|---|---|---|---|---|
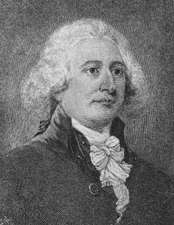 John Brown |
Anti-Administration | March 4, 1789 – June 1, 1792 |
1st 2nd |
Elected in 1789. Re-elected in 1790. Resigned. |
| Vacant | June 2, 1792 – March 3, 1793 | |||
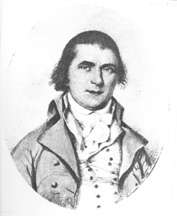 Andrew Moore |
Anti-Administration | March 4, 1793 – March 3, 1795 |
3rd 4th |
Redistricted from the 3rd district and re-elected in 1793. Re-elected in 1795. Retired. |
| Democratic-Republican | March 4, 1795 – March 3, 1797 | |||
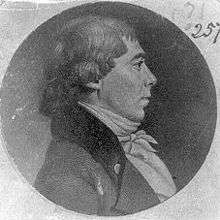 David Holmes |
Democratic-Republican | March 4, 1797 – March 3, 1803 |
5th 6th 7th |
Elected in 1797. Re-elected in 1799. Re-elected in 1801. Redistricted to the 4th district. |
| James Stephenson | Federalist | March 4, 1803 – March 3, 1805 |
8th | Elected in 1803. Lost re-election. |
| John Morrow | Democratic-Republican | March 4, 1805 – March 3, 1809 |
9th 10th |
Elected in 1805. Re-elected in 1807. Lost re-election. |
| James Stephenson | Federalist | March 4, 1809 – March 3, 1811 |
11th | Elected in 1809. Lost re-election. |
| John Baker | Federalist | March 4, 1811 – March 3, 1813 |
12th | Elected in 1811. Retired. |
| Francis White | Federalist | March 4, 1813 – March 3, 1815 |
13th | Elected in 1813. Lost re-election. |
| Magnus Tate | Federalist | March 4, 1815 – March 3, 1817 |
14th | Elected in 1815. Retired. |
| Edward Colston | Federalist | March 4, 1817 – March 3, 1819 |
15th | Elected in 1817. Lost re-election. |
| Thomas Van Swearingen | Federalist | March 4, 1819 – August 19, 1822 |
16th 17th |
Elected in 1819. Re-elected in 1821. Died. |
| Vacant | August 19, 1822 – October 28, 1822 | |||
| James Stephenson | Federalist | October 28, 1822 – March 3, 1823 |
17th | Elected to finish Van Swearingen's term and seated December 2, 1822. Redistricted to the 16th district. |
| Arthur Smith | Crawford Republican | March 4, 1823 – March 3, 1825 |
18th | Redistricted from the 20th district and Re-elected in 1823. Retired. |
| James Trezvant | Jacksonian | March 4, 1825 – March 3, 1831 |
19th 20th 21st |
Elected in 1825. Re-elected in 1827. Re-elected in 1829. [data unknown/missing] |
 John Y. Mason |
Jacksonian | March 4, 1831 – January 11, 1837 |
22nd 23rd 24th |
[data unknown/missing] Resigned. |
| Vacant | January 12, 1837 – March 3, 1837 | |||
| Francis E. Rives | Democratic | March 4, 1837 – March 3, 1841 |
25th 26th |
[data unknown/missing] Retired. |
| George B. Cary | Democratic | March 4, 1841 – March 3, 1843 |
27th | [data unknown/missing] Retired. |
| George Dromgoole | Democratic | March 4, 1843 – April 27, 1847 |
28th 29th 30th |
[data unknown/missing] Died. |
| Vacant | April 27, 1847 – August 5, 1847 | |||
| Richard K. Meade | Democratic | August 5, 1847 – March 3, 1853 |
30th 31st 32nd |
[data unknown/missing] Lost renomination. |
 John Millson |
Democratic | March 4, 1853 – March 3, 1861 |
33rd 34th 35th 36th |
[data unknown/missing] Retired. |
| Vacant | March 4, 1861 – January 26, 1870 |
Civil War | ||
| James H. Platt Jr. | Republican | January 27, 1870 – March 3, 1875 |
41st 42nd 43rd |
[data unknown/missing] Lost re-election. |
 John Goode Jr. |
Democratic | March 4, 1875 – March 3, 1881 |
44th 45th 46th |
[data unknown/missing] Lost re-election. |
 John F. Dezendorf |
Republican | March 4, 1881 – March 3, 1883 |
47th | [data unknown/missing] Retired. |
 Harry Libbey |
Readjuster | March 4, 1883 – March 3, 1885 |
48th 49th |
[data unknown/missing] |
| Republican | March 4, 1885 – March 3, 1887 |
[data unknown/missing] Lost re-election. | ||
 George E. Bowden |
Republican | March 4, 1887 – March 3, 1891 |
50th 51st |
[data unknown/missing] Lost re-election. |
 John W. Lawson |
Democratic | March 4, 1891 – March 3, 1893 |
52nd | [data unknown/missing] Retired. |
 David Gardiner Tyler |
Democratic | March 4, 1893 – March 3, 1897 |
53rd 54th |
[data unknown/missing] Lost re-election. |
| William A. Young | Democratic | March 4, 1897 – April 26, 1898 |
55th | Election invalidated |
 Richard A. Wise |
Republican | April 26, 1898 – March 3, 1899 |
55th | [data unknown/missing] Lost re-election. |
| William A. Young | Democratic | March 4, 1899 – March 12, 1900 |
56th | Election invalidated |
Richard A. Wise |
Republican | March 12, 1900 – December 21, 1900 |
56th | [data unknown/missing] Died. |
| Vacant | December 21, 1900 – March 3, 1901 | |||
 Harry L. Maynard |
Democratic | March 4, 1901 – March 3, 1911 |
57th 58th 59th 60th 61st |
[data unknown/missing] Lost re-election. |
 Edward E. Holland |
Democratic | March 4, 1911 – March 3, 1921 |
62nd 63rd 64th 65th 66th |
[data unknown/missing] Retired. |
 Joseph T. Deal |
Democratic | March 4, 1921 – March 3, 1929 |
67th 68th 69th 70th |
[data unknown/missing] Lost re-election. |
| Menalcus Lankford | Republican | March 4, 1929 – March 3, 1933 |
71st 72nd |
[data unknown/missing] Lost re-election. |
| District eliminated March 4, 1933 | ||||
| District recreated: January 3, 1935 | ||||
| Colgate Darden | Democratic | January 3, 1935 – January 3, 1937 |
74th | [data unknown/missing] Lost renomination. |
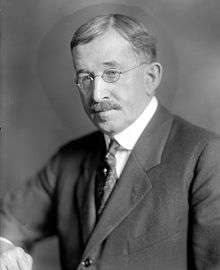
_in_1916.jpg) Norman R. Hamilton |
Democratic | January 3, 1937 – January 3, 1939 |
75th | [data unknown/missing] Lost renomination. |
.jpg) Colgate Darden |
Democratic | January 3, 1939 – March 1, 1941 |
76th 77th |
[data unknown/missing] Resigned to run for Governor of Virginia. |
| Vacant | March 1, 1941 – April 8, 1941 | |||
| Winder R. Harris | Democratic | April 8, 1941 – September 15, 1944 |
77th 78th |
[data unknown/missing] Resigned. |
| Vacant | September 15, 1944 – November 7, 1944 | |||
 Ralph H. Daughton |
Democratic | November 7, 1944 – January 3, 1947 |
78th 79th |
[data unknown/missing] Lost renomination. |
 Porter Hardy Jr. |
Democratic | January 3, 1947 – January 3, 1969 |
80th 81st 82nd 83rd 84th 85th 86th 87th 88th 89th 90th |
[data unknown/missing] Retired. |
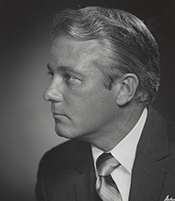
 G. William Whitehurst |
Republican | January 3, 1969 – January 3, 1987 |
91st 92nd 93rd 94th 95th 96th 97th 98th 99th |
[data unknown/missing] Retired. |
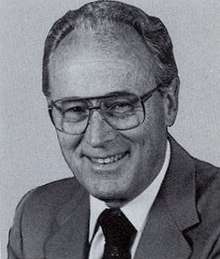
 Owen B. Pickett |
Democratic | January 3, 1987 – January 3, 2001 |
100th 101st 102nd 103rd 104th 105th 106th |
[data unknown/missing] Retired. |
 Ed Schrock |
Republican | January 3, 2001 – January 3, 2005 |
107th 108th |
[data unknown/missing] Retired. |
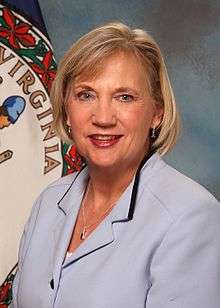 Thelma Drake |
Republican | January 3, 2005 – January 3, 2009 |
109th 110th |
[data unknown/missing] Lost re-election. |
 Glenn Nye |
Democratic | January 3, 2009 – January 3, 2011 |
111th | [data unknown/missing] Lost re-election. |
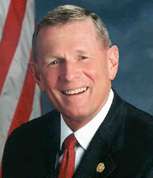
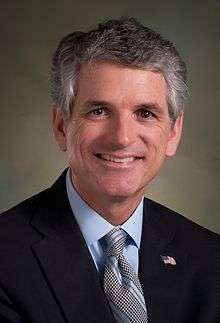 Scott Rigell |
Republican | January 3, 2011 – January 3, 2017 |
112th 113th 114th |
[data unknown/missing] Retired. |
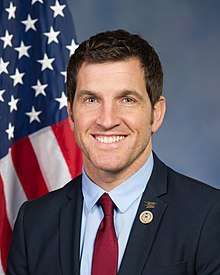 Scott Taylor |
Republican | January 3, 2017 – January 3, 2019 |
115th | [data unknown/missing] Lost re-election. |
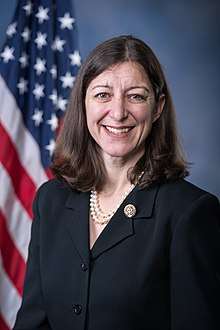 Elaine Luria |
Democratic | January 3, 2019 – Present |
116th | Elected in 2018. |
Election results
1980s
| Party | Candidate | Votes | % | |
|---|---|---|---|---|
| Republican | G. William Whitehurst (Incumbent) | 97,319 | 89.84% | |
| Independent | Kenneth P. Morrison | 11,003 | 10.16% | |
| Write-in | 6 | 0.01% | ||
| Total votes | 108,328 | 100% | ||
| Republican hold | ||||
| Party | Candidate | Votes | % | |
|---|---|---|---|---|
| Republican | G. William Whitehurst (Incumbent) | 78,108 | 99.88% | |
| Write-in | 97 | 0.12% | ||
| Total votes | 78,205 | 100% | ||
| Republican hold | ||||
| Party | Candidate | Votes | % | |
|---|---|---|---|---|
| Republican | G. William Whitehurst (Incumbent) | 136,632 | 99.81% | |
| Write-in | 256 | 0.19% | ||
| Total votes | 136,888 | 100% | ||
| Republican hold | ||||
| Party | Candidate | Votes | % | |||
|---|---|---|---|---|---|---|
| Democratic | Owen B. Pickett | 54,491 | 49.46% | |||
| Republican | A. Joe Canada Jr. | 46,137 | 41.88% | |||
| Independent | Stephen P. Shao | 9,492 | 8.62% | |||
| Write-in | 49 | 0.04% | ||||
| Total votes | 110,169 | 100% | ||||
| Democratic gain from Republican | ||||||
| Party | Candidate | Votes | % | |
|---|---|---|---|---|
| Democratic | Owen B. Pickett (Incumbent) | 106,666 | 60.53% | |
| Republican | Jerry R. Curry | 62,564 | 35.51% | |
| Independent | Stephen P. Shao | 4,255 | 2.41% | |
| Independent | Robert A. Smith | 2,691 | 1.53% | |
| Write-in | 32 | 0.02% | ||
| Total votes | 176,208 | 100% | ||
| Democratic hold | ||||
1990s
| Party | Candidate | Votes | % | |
|---|---|---|---|---|
| Democratic | Owen B. Pickett (Incumbent) | 55,179 | 74.95% | |
| Independent | Harry G. Broskie | 15,915 | 21.62% | |
| Write-in | 2,524 | 3.43% | ||
| Total votes | 73,618 | 100% | ||
| Democratic hold | ||||
| Party | Candidate | Votes | % | |
|---|---|---|---|---|
| Democratic | Owen B. Pickett (Incumbent) | 99,253 | 56.03% | |
| Republican | J. L. Chapman IV | 77,797 | 43.92% | |
| Write-in | 83 | 0.05% | ||
| Total votes | 177,133 | 100% | ||
| Democratic hold | ||||
| Party | Candidate | Votes | % | |
|---|---|---|---|---|
| Democratic | Owen B. Pickett (Incumbent) | 81,372 | 59.05% | |
| Republican | J. L. Chapman IV | 56,375 | 40.91% | |
| Write-in | 55 | 0.04% | ||
| Total votes | 137,802 | 100% | ||
| Democratic hold | ||||
| Party | Candidate | Votes | % | |
|---|---|---|---|---|
| Democratic | Owen B. Pickett (Incumbent) | 106,215 | 64.77% | |
| Republican | John F. Tate | 57,586 | 35.11% | |
| Write-in | 195 | 0.12% | ||
| Total votes | 163,996 | 100% | ||
| Democratic hold | ||||
| Party | Candidate | Votes | % | |
|---|---|---|---|---|
| Democratic | Owen B. Pickett (Incumbent) | 67,975 | 94.29% | |
| Write-in | 4,116 | 5.71% | ||
| Total votes | 72,091 | 100% | ||
| Democratic hold | ||||
2000s
| Party | Candidate | Votes | % | |||
|---|---|---|---|---|---|---|
| Republican | Edward L. Schrock | 97,856 | 51.96% | |||
| Democratic | Jody M. Wagner | 90,328 | 47.96% | |||
| Write-in | 145 | 0.08% | ||||
| Total votes | 188,329 | 100% | ||||
| Republican gain from Democratic | ||||||
| Party | Candidate | Votes | % | |
|---|---|---|---|---|
| Republican | Edward L. Schrock (Incumbent) | 103,807 | 83.15% | |
| Green | D. C. Amarasinghe | 20,589 | 16.49% | |
| Write-in | 450 | 0.36% | ||
| Total votes | 124,846 | 100% | ||
| Republican hold | ||||
| Party | Candidate | Votes | % | |
|---|---|---|---|---|
| Republican | Thelma D. Drake | 132,946 | 55.08% | |
| Democratic | David B. Ashe | 108,180 | 44.82% | |
| Write-in | 254 | 0.11% | ||
| Total votes | 241,380 | 100% | ||
| Republican hold | ||||
| Party | Candidate | Votes | % | |
|---|---|---|---|---|
| Republican | Thelma D. Drake (Incumbent) | 88,777 | 51.27% | |
| Democratic | Phil Kellam | 83,901 | 48.45% | |
| Write-in | 481 | 0.28% | ||
| Total votes | 173,159 | 100% | ||
| Republican hold | ||||
| Party | Candidate | Votes | % | |||
|---|---|---|---|---|---|---|
| Democratic | Glenn Nye | 141,857 | 52.40% | |||
| Republican | Thelma D. Drake (Incumbent) | 128,486 | 47.46% | |||
| Write-in | 368 | 0.14% | ||||
| Total votes | 270,711 | 100% | ||||
| Democratic gain from Republican | ||||||
2010s
| Party | Candidate | Votes | % | |||
|---|---|---|---|---|---|---|
| Republican | E. Scott Rigell | 88,340 | 53.12% | |||
| Democratic | Glenn Nye (Incumbent) | 70,591 | 42.45% | |||
| Independent | Kenny E. Golden | 7,194 | 4.33% | |||
| Write-in | 164 | 0.10% | ||||
| Total votes | 166,289 | 100% | ||||
| Republican gain from Democratic | ||||||
| Party | Candidate | Votes | % | |
|---|---|---|---|---|
| Republican | E. Scott Rigell (Incumbent) | 166,231 | 53.76% | |
| Democratic | Paul O. Hirschbiel, Jr. | 142,548 | 46.10% | |
| Write-in | 443 | 0.14% | ||
| Total votes | 309,222 | 100% | ||
| Republican hold | ||||
| Party | Candidate | Votes | % | |
|---|---|---|---|---|
| Republican | E. Scott Rigell (Incumbent) | 101,558 | 58.68% | |
| Democratic | Suzanne Patrick | 71,178 | 41.13% | |
| Write-in | 324 | 0.19% | ||
| Total votes | 173,060 | 100% | ||
| Republican hold | ||||
| Party | Candidate | Votes | % | |
|---|---|---|---|---|
| Republican | Scott Taylor | 190,475 | 61.33% | |
| Democratic | Shaun D. Brown | 119,440 | 38.46% | |
| Write-in | 652 | 0.21% | ||
| Total votes | 310,567 | 100.00% | ||
| Republican hold | ||||
| Party | Candidate | Votes | % | |||
|---|---|---|---|---|---|---|
| Democratic | Elaine Luria | 139,571 | 51.05% | |||
| Republican | Scott Taylor (Incumbent) | 133,458 | 48.81% | |||
| Write-in | 371 | 0.14% | ||||
| Total votes | 273,400 | 100.00% | ||||
| Democratic gain from Republican | ||||||
Historical district boundaries
See also
- Virginia's congressional districts
- List of United States congressional districts
- United States House of Representatives elections in Virginia, 2008#District 2
- Virginia's 2nd congressional district election, 2006
References
- Geography, US Census Bureau. "Congressional Districts Relationship Files (state-based)". www.census.gov.
- Bureau, Center for New Media & Promotion (CNMP), US Census. "My Congressional District". www.census.gov.
- "My Congressional District".
- "Partisan Voting Index – Districts of the 115th Congress" (PDF). The Cook Political Report. April 7, 2017. Retrieved April 7, 2017.
- "Court Ordered Redistricting". Redistricting.dls.virginia.gov. September 3, 2015. Retrieved May 6, 2017.
- http://redistricting.dls.virginia.gov/2010/Data/Court%20Ordered%20Redistricting/2016%2001%2007%20Personnhuballah%20v%20Alcorn%20Civil%20Action%20No.%203-13cv678.pdf
- "Supreme Court weighs legality of Virginia redistricting". The Hill. March 21, 2016. Retrieved May 6, 2017.
- Todd Ruger (February 1, 2016). "Supreme Court Allows Virginia Redistricting to Stand in 2016". Roll Call. Retrieved May 6, 2017.
- Andrew Cain (January 7, 2016). "Judges impose new Va. congressional map, redrawing 3rd, 4th Districts &". Richmond Times-Dispatch. Retrieved May 6, 2017.
- "November 5, 1996 General Election For Office of PRESIDENT/VICE PRESIDENT of the United States". Virginia State Board of Elections. Retrieved December 21, 2012.
- "NOVEMBER 4, 1997 GENERAL ELECTION For Office of Governor". Virginia State Board of Elections. Retrieved December 21, 2012.
- "November 7th - General Election". Virginia State Board of Elections. November 20, 2000. Retrieved December 21, 2012.
- "Official Results: Governor". Virginia State Board of Elections. Retrieved December 21, 2012.
- "Official Results: Senate". Virginia State Board of Elections. Retrieved December 21, 2012.
- "November 2nd - General Election Official Results". Virginia State Board of Elections. Retrieved December 21, 2012.
- "November 2005 Official Results". Virginia State Board of Elections. Retrieved July 6, 2013.
- "November 2006 Official Results". Virginia State Board of Elections. Retrieved July 6, 2013.
- "November 2008 Official Results". Virginia State Board of Elections. Retrieved December 21, 2012.
- "November 2009 Official Results". Virginia State Board of Elections. Retrieved July 6, 2013.
- "November 2009 Official Results". Virginia State Board of Elections. Retrieved July 6, 2013.
- "November 2012 Official Results". Virginia State Board of Elections. Retrieved July 6, 2013.
- "Governor>Votes by District". November 2013 General Election Official Results. Virginia State Board of Elections. Retrieved July 5, 2020.
- "Lieutenant Governor>Votes by District". November 2013 General Election Official Results. Virginia State Board of Elections. Retrieved July 5, 2020.
- "Attorney General>Votes by District". November 2013 General Election Official Results. Virginia State Board of Elections. Retrieved July 5, 2020.
- "Turnout by Congressional District". The Virginia Public Access Project. Retrieved July 4, 2020.
- "2017 Cook Political Report Partisan Voter Index". The Cook Political Report. Retrieved September 10, 2018.
- "2017 Governor's Election Results by Congressional District". The Virginia Public Access Project. Retrieved June 16, 2018.
- "2018 U.S. Senate Results by Congressional District". The Virginia Public Access Project. Retrieved June 16, 2018.
- "Archived copy". Archived from the original on November 7, 2014. Retrieved November 27, 2014.CS1 maint: archived copy as title (link)
- "2016 November General Congress". Virginia State Board of Elections. Retrieved November 24, 2016.
- "2018 November General Congress". Virginia State Board of Elections. Retrieved December 7, 2018.
- Martis, Kenneth C. (1989). The Historical Atlas of Political Parties in the United States Congress. New York: Macmillan Publishing Company.
- Martis, Kenneth C. (1982). The Historical Atlas of United States Congressional Districts. New York: Macmillan Publishing Company.
- Congressional Biographical Directory of the United States 1774–present