Tropical cyclones in 2007
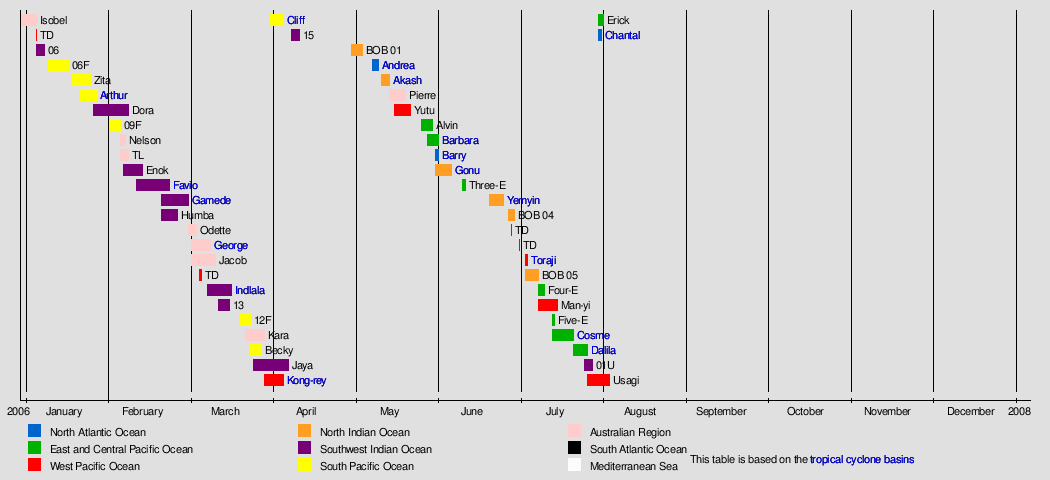
During 2007, tropical cyclones formed within seven different tropical cyclone basins, located within various parts of the Atlantic, Pacific and Indian Oceans. During the year, a total of 129 systems formed with 79 of these developing further and were named by the responsible warning centre. The strongest tropical cyclone of the year was Cyclone George, which was estimated to have a minimum barometric pressure of 902 hPa (26.64 inHg).
| Tropical cyclones in 2007 | |
|---|---|
| Year boundaries | |
| First system | Isobel |
| Formed | December 30, 2006 |
| Last system | Helen |
| Dissipated | January 6, 2008 |
| Strongest system | |
| Name | George |
| Lowest pressure | 902 mbar/hPa; 26.64 inHg |
| Longest lasting system | |
| Name | Dora |
| Duration | 13 days |
| Year statistics | |
| Total systems | 129 |
| Named systems | 79 |
| Total fatalities | 17,551 total |
| Total damage | $21.44 billion (2007 USD) |
The most active basin in the year was the Western Pacific, which documented 24 named systems. The North Atlantic had an above-average season with 15 named storms. The Eastern Pacific hurricane season experienced a below-average number of tropical storm intensity systems, numbering 11. Activity across the southern hemisphere's three basins – South-West Indian, Australian, and South Pacific – was fairly significant, with the regions recording 25 named storms altogether, with the most intense Southern Hemisphere cyclone of the year,
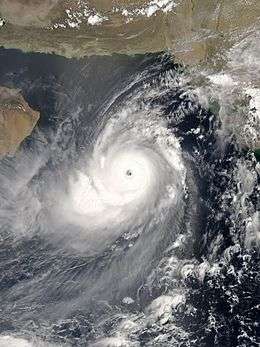
The deadliest tropical cyclone of the year was Cyclone Sidr in the North Indian Ocean which killed 15,000 people in Bangladesh and the costliest tropical cyclone of the year was Cyclone Gonu in the North Indian Ocean, which caused more than $4.41 billion in damage after striking Oman, United Arab Emirates, Iran and Pakistan.
Global atmospheric and hydrological conditions
North Atlantic Ocean
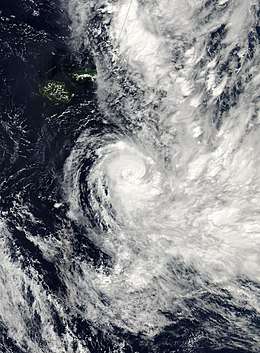
The activity was a slightly above-average Atlantic hurricane season, featuring many weak and short-lived storms. Despite the high activity of weak storms during 2007, it was the first season to feature more than one Category 5 landfalling hurricane, a feat that would not be matched until ten years later. It produced 17 tropical cyclones, 15 tropical storms, six hurricanes, and two major hurricanes. The first system, Subtropical Storm Andrea, developed on May 9, while the last storm, Tropical Storm Olga, dissipated on December 13. The most intense hurricane, Dean, is tied for the eighth-most-intense Atlantic hurricane ever recorded as well as the third most intense Atlantic hurricane at landfall. The season was one of only seven on record for the Atlantic with more than one Category 5 hurricane. It was the second on record in which an Atlantic hurricane, Felix, and an eastern Pacific hurricane, Henriette, made landfall on the same day. September had a record-tying eight storms, although the strengths and durations of most of the storms were low. Aside from hurricanes Dean and Felix, none of the storms in the season exceeded Category 1 intensity.
Several storms made landfall or directly affected land. Hurricanes Dean and Felix made landfall at Category 5 intensity, causing severe damage in parts of Mexico and Central America, respectively. Both storm names, as well as Noel, the name of a hurricane that affected the Caribbean, were retired from the naming list of Atlantic hurricanes. The United States was affected by five cyclones, although the storms were generally weak; three tropical depressions and only two tropical storms, Barry and Gabrielle, and one hurricane, Humberto, made landfall in the country. Elsewhere, three storms directly affected Canada, although none severely. The combined storms killed at least 478 people and caused about $3.42 billion (2007 USD, $4.22 billion 2020 USD) in damage.[nb 1]
Eastern Pacific Ocean
The activity was a below-average Pacific hurricane season, featuring one major hurricane. The first tropical cyclone of the season, Alvin, developed on May 27, while the final system of the year, Kiko, dissipated on October 23. Due to unusually strong wind shear, activity fell short of the long-term average, with a total of 11 named storms, 4 hurricanes, and 1 major hurricane. At the time, 2007 featured the second-lowest value of the Accumulated cyclone energy (ACE) index since reliable records began in 1971. Two tropical cyclones – Cosme and Flossie – crossed into the central Pacific basin during the year, activity below the average of 4 to 5 systems. Impact during the season was relatively minimal. In early June, Tropical Storm Barbara moved ashore just northwest of the Mexico–Guatemala border, causing $55 million (2007 USD)[nb 2] in damage and 4 deaths. In late July, Cosme passed south of the island of Hawaii as a weakening tropical depression; light rain and increased surf resulted. A few days later, Dalila passed offshore the coastline of southwestern Mexico, killing 11 and causing minimal damage. Hurricane Flossie followed a similar track to Cosme in mid-August, producing gusty winds and light precipitation in Hawaii. Hurricane Henriette in early September produced torrential rainfall in southwestern Mexico, killing 6 and causing $25 million in damage. Baja California received moderate rains from Hurricane Ivo in mid-September, though no damage nor fatalities were reported. In mid-October, Tropical Storm Kiko passed just offshore the coastline of southwestern Mexico. Though no deaths were reported on the Mexico mainland, the storm capsized a ship with 30 people on board, 15 of whom were recovered dead, and 9 of whom were reported missing. Overall, the season ended with $80 million in damage and 49 deaths.
North Indian Ocean
The activity was an active year for this basin; it was the most destructive season in known history at this time, only for the 2008 season to surpass it the next year. 2007 was also the first season to have multiple Category 5 cyclones (by the Saffir Simpson Scale), and the two Category 5's, Sidr and Gonu, were also the first named Category 5 cyclones to form in their respective seas; Gonu in the Arabian Sea, and Sidr in the Bay of Bengal. Other notable storms of the season include Akash and Yemyin, both of which caused substantial damage and deaths. At least 4,545 deaths were reported, and damage was about 6.4 billion dollars.
Summary
Systems
January
| Storm name | Dates active | Max wind mph (km/h) | Min pressure (mbar) | Areas affected | Damage (USD) | Deaths | Refs |
|---|---|---|---|---|---|---|---|
| Isobel | December 30, 2006 – January 5, 2007 | 85 (50) | 982 | None | None | None | |
| TD | January 5 | Unspecified | 1006 | None | None | None | |
| 06 | January 5 – 8 | 45 (30) | 999 | None | None | None | |
| 06F | January 9 – 17 | 55 (35) | 1000 | None | None | None | |
| Zita | January 18 – 25 | 100 (65) | 975 | French Polynesia | None | None | |
| Arthur | January 21 – 27 | 100 (65) | 975 | Samoan Islands, Cook Islands, French Polynesia | None | None | |
| Dora | January 26 – February 8 | 195 (120) | 925 | Rodrigues | None | None |
February
| Storm name | Dates active | Max wind mph (km/h) | Min pressure (mbar) | Areas affected | Damage (USD) | Deaths | Refs |
|---|---|---|---|---|---|---|---|
| 09F | February 1 – 5 | Unspecified | 997 | Fiji | None | None | |
| Nelson | February 5 – 7 | 95 (60) | 985 | Southern Gulf of Carpentaria | Minimal | None | |
| TL | February 5 – 8 | 85 (50) | 995 | None | None | None | |
| Enok | February 6 – 13 | 110 (70) | 978 | None | None | None | |
| Favio | February 11 – 23 | 195 (120) | 925 | Mozambique, Madagascar | $71 million | 10 | |
| Gamede | February 20 – March 2 | 165 (105) | 935 | Mascarene Islands | $120 million | 4 | |
| Humba | February 20 – 26 | 140 (85) | 960 | None | None | None | |
March
| Storm name | Dates active | Max wind mph (km/h) | Min pressure (mbar) | Areas affected | Damage (USD) | Deaths | Refs |
|---|---|---|---|---|---|---|---|
| Odette | March 2 – 5 | 75 (45) | 990 | None | None | None | |
| George | March 3 – 10 | 205 (125) | 902 | Northern Territory, Western Australia | $15.7 million | 5 | |
| Jacob | March 3 – 12 | 130 (80) | 958 | Western Australia | None | None | |
| TD | March 6 – 7 | Unspecified | 1002 | None | None | None | |
| Indlala | March 9 – 18 | 175 (110) | 935 | St. Brandon, Agaléga, Madagascar | $240 million | 150 | |
| 13 | March 13 – 17 | 45 (30) | 1002 | None | None | None | |
| 12F | March 21 – 25 | 55 (35) | 998 | None | None | None | |
| Kara | March 23 – 30 | 155 (100) | 948 | None | None | None | |
| Becky | March 25 – 29 | 110 (70) | 975 | Solomon Islands, Vanuatu, New Caledonia | None | None | |
| Jaya | March 26 – April 8 | 185 (115) | 935 | Madagascar | Minimal | 1 | |
| Kong-rey | March 30 – April 6 | 150 (90) | 960 | Mariana Islands | $10 thousand | None | |
April
Two tropical cyclones were formed and one was named in the month of April, becoming the least active in modern history. Cyclone Cliff caused widespread damage in Fiji and Tonga killing four people.
| Storm name | Dates active | Max wind mph (km/h) | Min pressure (mbar) | Areas affected | Damage (USD) | Deaths | Refs |
|---|---|---|---|---|---|---|---|
| Cliff | April 1 – 6 | 100 (65) | 980 | Fiji, Tonga | $4.0 million | 4 | |
| 15 | April 9 – 12 | 95 (60) | 994 | None | None | None | |
May
| Storm name | Dates active | Max wind mph (km/h) | Min pressure (mbar) | Areas affected | Damage (USD) | Deaths | Refs |
|---|---|---|---|---|---|---|---|
| BOB 01 | May 1 – 5 | 45 (30) | 998 | Thailand, Myanmar | $500,000 | None | |
| Andrea | May 9 – 11 | 95 (60) | 1001 | Virginia, Southeastern U.S., Bahamas | Minimal | 6 | |
| Akash | May 12 – 15 | 85 (50) | 982 | Andaman Islands, Nicobar Islands, Bangladesh, Burma | $982 million | 14 | |
| Pierre | May 15 – 21 | 75 (45) | 990 | Papua New Guinea | Minimal | None | |
| Yutu (Amang) | May 17 – 23 | 175 (110) | 935 | None | None | None | |
| Alvin | May 27 – 31 | 65 (40) | 1003 | None | None | None | |
| Barbara | May 29 – June 2 | 85 (50) | 1000 | Southwestern Mexico, Guatemala, El Salvador | $55 million | 4 | |
June
| Storm name | Dates active | Max wind mph (km/h) | Min pressure (mbar) | Areas affected | Damage (USD) | Deaths | Refs |
|---|---|---|---|---|---|---|---|
| Barry | June 1 – 2 | 95 (60) | 997 | El Salvador, Cuba, Florida, East Coast of the United States | $118 thousand | 3 | |
| Gonu | June 1 – 7 | 240 (150) | 920 | Oman, United Arab Emirates, Iran, Pakistan | $4.4 billion | 78 | |
| Three-E | June 11 – 12 | 55 (35) | 1004 | None | None | None | |
| Yemyin | June 21 – 26 | 65 (40) | 986 | India, Pakistan, Afghanistan | $2.1 billion | 983 | |
| BOB 04 | June 28 – 30 | 55 (35) | 989 | India | Unknown | 57 | |
| TD | June 29 | Unspecified | 1006 | Caroline Islands | None | None | |
July
| Storm name | Dates active | Max wind mph (km/h) | Min pressure (mbar) | Areas affected | Damage (USD) | Deaths | Refs |
|---|---|---|---|---|---|---|---|
| TD | July 2 | Unspecified | 1006 | Caroline Islands | None | None | |
| Toraji | July 4 – 5 | 65 (40) | 994 | China, Vietnam | $9.7 million | None | |
| BOB 05 | July 4 – 9 | 55 (35) | 988 | Bangladesh | Unknown | 16 | |
| Four-E | July 9 – 11 | 55 (35) | 1006 | None | None | None | |
| Man-yi (Bebeng) | July 9 – 16 | 175 (110) | 935 | Japan, Aleutian Islands | $105 thousand | 16 | |
| Five-E | July 14 – 15 | 55 (35) | 1006 | None | None | None | |
| Cosme | July 14 – 22 | 120 (75) | 987 | Hawaii | None | None | |
| Dalila | July 22 – 27 | 95 (60) | 995 | Baja California Sur, Jalisco, Socorro Island | Minimal | 11 | |
| 01U | July 26 – 29 | 75 (45) | 992 | None | None | None | |
| Usagi | July 27 – August 4 | 165 (105) | 945 | Japan, Korean Peninsula, Russia | $225 million | None | |
| Erick | July 31 – August 2 | 65 (40) | 1004 | None | None | None | |
| Chantal | July 31 – August 2 | 85 (50) | 994 | Bermuda, Atlantic Canada, Newfoundland | $24.3 million | None | |
August
| Storm name | Dates active | Max wind mph (km/h) | Min pressure (mbar) | Areas affected | Damage (USD) | Deaths | Refs |
|---|---|---|---|---|---|---|---|
September
| Storm name | Dates active | Max wind mph (km/h) | Min pressure (mbar) | Areas affected | Damage (USD) | Deaths | Refs |
|---|---|---|---|---|---|---|---|
October
| Storm name | Dates active | Max wind mph (km/h) | Min pressure (mbar) | Areas affected | Damage (USD) | Deaths | Refs |
|---|---|---|---|---|---|---|---|
November
| Storm name | Dates active | Max wind mph (km/h) | Min pressure (mbar) | Areas affected | Damage (USD) | Deaths | Refs |
|---|---|---|---|---|---|---|---|
December
| Storm name | Dates active | Max wind mph (km/h) | Min pressure (mbar) | Areas affected | Damage (USD) | Deaths | Refs |
|---|---|---|---|---|---|---|---|
Global effects
- The sum of the number of systems and fatalities in each basin will not equal the number shown as the total. This is because when systems move between basins, it creates a discrepancy in the actual number of systems and fatalities.
Notes
- The cumulative damage figures were obtained by summing the damage figures on the individual Tropical Cyclone Reports referenced throughout the article, with the exception of Hurricane Dean. Dean's damage figures were obtained by adding the per-country totals referenced in the Impact section of this article.
- All damage totals are in 2007 USD unless otherwise stated.
1 Only systems that formed either on or after January 1, 2007 are counted in the seasonal totals.
2 Only systems that formed either before or on December 31, 2007 are counted in the seasonal totals.
3 The wind speeds for this tropical cyclone/basin are based on the IMD Scale which uses 3-minute sustained winds.
4 The wind speeds for this tropical cyclone/basin are based on the Saffir Simpson Scale which uses 1-minute sustained winds.
5The wind speeds for this tropical cyclone are based on Météo-France which uses gust winds.
See also
- List of earthquakes in 2007
- Tornadoes of 2007
- 2007 Pacific typhoon season
- 2007 Pacific hurricane season
- 2007 Atlantic hurricane season
- 2007 North Indian Ocean cyclone season
- Australian region cyclone seasons: 2006–07, 2007–08
- South-West Indian Ocean cyclone seasons: 2006–07, 2007–08
- South Pacific cyclone seasons: 2006–07, 2007–08
References
External links
Regional Specialized Meteorological Centers
- US National Hurricane Center – North Atlantic, Eastern Pacific
- Central Pacific Hurricane Center – Central Pacific
- Japan Meteorological Agency – NW Pacific
- India Meteorological Department – Bay of Bengal and the Arabian Sea
- Météo-France – La Reunion – South Indian Ocean from 30°E to 90°E
- Fiji Meteorological Service – South Pacific west of 160°E, north of 25° S
Tropical Cyclone Warning Centers
- Meteorology, Climatology, and Geophysical Agency of Indonesia – South Indian Ocean from 90°E to 141°E, generally north of 10°S
- Australian Bureau of Meteorology (TCWC's Perth, Darwin & Brisbane) – South Indian Ocean & South Pacific Ocean from 90°E to 160°E, generally south of 10°S
- Papua New Guinea National Weather Service – South Pacific Ocean from 141°E to 160°E, generally north of 10°S
- Meteorological Service of New Zealand Limited – South Pacific west of 160°E, south of 25°S
![]()