Demographics of Burundi
This article is about the demographic features of the population of Burundi, including population density, ethnicity, education level, health of the populace, economic status, religious affiliations and other aspects of the population.
At 206.1 persons per km²., Burundi has the second-largest population density in Sub-Saharan Africa. Most people live on farms near areas of fertile volcanic soil. The population is made up of three major ethnic groups – Hutu (Bahutu), Tutsi (Batutsi or Watusi), and Twa (Batwa). Kirundi is the common language. Intermarriage takes place frequently between the Hutus and Tutsis. The terms "pastoralist" and "agriculturist", often used as ethnic designations for Watusi and Bahutu, respectively, are only occupational titles which vary among individuals and groups. Although Hutus encompass the majority of the population, historically Tutsis have been politically and economically dominant.
Population
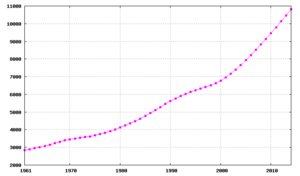
According to the 2019 revision of the World Population Prospects[1][2], the total population was 11,175,374 in 2018, compared to only 2 456 000 in 1950. The proportion of children below the age of 15 in 2015 was 44.8%, 52.7% was between 15 and 65 years of age, while 2.5% was older than 65 years old .[3]
| Total population | Population aged 0–14 (%) | Population aged 15–64 (%) | Population aged 65+ (%) | |
|---|---|---|---|---|
| 1950 | 2 456 000 | 40.9 | 55.9 | 3.2 |
| 1955 | 2 687 000 | 42.8 | 54.1 | 3.1 |
| 1960 | 2 940 000 | 44.0 | 53.0 | 3.0 |
| 1965 | 3 213 000 | 45.0 | 51.9 | 3.1 |
| 1970 | 3 513 000 | 44.6 | 52.2 | 3.3 |
| 1975 | 3 680 000 | 45.5 | 51.1 | 3.4 |
| 1980 | 4 130 000 | 44.7 | 51.8 | 3.5 |
| 1985 | 4 851 000 | 43.7 | 52.9 | 3.3 |
| 1990 | 5 602 000 | 44.6 | 52.3 | 3.2 |
| 1995 | 6 087 000 | 46.0 | 51.0 | 3.0 |
| 2000 | 6 374 000 | 46.2 | 50.9 | 2.9 |
| 2005 | 7 251 000 | 41.8 | 55.4 | 2.9 |
| 2010 | 8 383 000 | 37.9 | 59.3 | 2.9 |
| 2015 | 11 179 000 | 44.8 | 52.7 | 2.5 |
UN population projections
Numbers are in thousands. UN medium variant projections[3]
- 2010 8,382
- 2015 9,230
- 2020 10,057
- 2025 10,791
- 2030 11,441
- 2035 12,052
- 2040 12,651
- 2045 13,215
- 2050 13,703
Vital statistics
Registration of vital events is in Burundi not complete. The Population Departement of the United Nations prepared the following estimates. [3]
| Period | Live births per year | Deaths per year | Natural change per year | CBR* | CDR* | NC* | TFR* | IMR* |
|---|---|---|---|---|---|---|---|---|
| 1950-1955 | 125 000 | 65 000 | 60 000 | 48.4 | 25.1 | 23.4 | 6.80 | 167 |
| 1955-1960 | 131 000 | 66 000 | 65 000 | 46.6 | 23.6 | 23.0 | 6.80 | 157 |
| 1960-1965 | 139 000 | 68 000 | 71 000 | 45.3 | 22.0 | 23.2 | 6.80 | 149 |
| 1965-1970 | 149 000 | 69 000 | 80 000 | 44.5 | 20.6 | 23.8 | 6.80 | 140 |
| 1970-1975 | 158 000 | 73 000 | 85 000 | 44.0 | 20.2 | 23.8 | 6.80 | 137 |
| 1975-1980 | 174 000 | 73 000 | 101 000 | 44.7 | 18.8 | 25.9 | 6.80 | 127 |
| 1980-1985 | 204 000 | 79 000 | 125 000 | 45.3 | 17.6 | 27.8 | 6.50 | 118 |
| 1985-1990 | 242 000 | 91 000 | 151 000 | 46.3 | 17.5 | 28.9 | 6.50 | 116 |
| 1990-1995 | 261 000 | 114 000 | 147 000 | 44.7 | 19.5 | 25.2 | 6.45 | 126 |
| 1995-2000 | 249 000 | 112 000 | 138 000 | 40.0 | 17.9 | 22.1 | 6.08 | 117 |
| 2000-2005 | 245 000 | 110 000 | 135 000 | 36.0 | 16.1 | 19.9 | 5.41 | 107 |
| 2005-2010 | 268 000 | 116 000 | 152 000 | 34.3 | 14.8 | 19.5 | 4.66 | 101 |
| * CBR = crude birth rate (per 1000); CDR = crude death rate (per 1000); NC = natural change (per 1000); IMR = infant mortality rate per 1000 births; TFR = total fertility rate (number of children per woman) | ||||||||
Fertility and births
Total Fertility Rate (TFR) (Wanted Fertility Rate) and Crude Birth Rate (CBR):[4][5]
| Year | CBR (Total) | TFR (Total) | CBR (Urban) | TFR (Urban) | CBR (Rural) | TFR (Rural) |
|---|---|---|---|---|---|---|
| 1987 | 6.6 | 5.2 | 6.6 | |||
| 2010 | 44.5 | 6.4 (4.2) | 37.3 | 4.8 (3.4) | 45.3 | 6.6 (4.3) |
| 2016-17 | 37.9 | 5.5 (3.6) | 33.0 | 4.1 (3.0) | 38.5 | 5.7 (3.7) |
Fertility data as of 2010 (DHS Program):[5]
| Region | Total fertility rate | Percentage of women age 15-49 currently pregnant | Mean number of children ever born to women age 40-49 |
|---|---|---|---|
| Bujumbura Mairie | 4.2 | 7.9 | 5.3 |
| Nord | 6.7 | 10.1 | 6.4 |
| Centre-Est | 6.3 | 10.5 | 6.6 |
| Ouest | 7.1 | 11.7 | 7.2 |
| Sud | 6.2 | 10.8 | 6.8 |
Life expectancy
| Period | Life expectancy in Years[6] |
|---|---|
| 1950–1955 | 39.03 |
| 1955–1960 | |
| 1960–1965 | |
| 1965–1970 | |
| 1970–1975 | |
| 1975–1980 | |
| 1980–1985 | |
| 1985–1990 | |
| 1990–1995 | |
| 1995–2000 | |
| 2000–2005 | |
| 2005–2010 | |
| 2010–2015 |
Other demographic statistics
Demographic statistics according to the World Population Review in 2019.[7]
- One birth every 1 minutes
- One death every 5 minutes
- One net migrant every 144 minutes
- Net gain of one person every 1 minutes
The following demographic statistics are from the CIA World Factbook, unless otherwise indicated.[8]
Population
- 11,844,520 (July 2018 est.)
- 10,742,276
- Note: estimates for this country explicitly take into account the effects of excess mortality due to AIDS; this can result in lower life expectancy, higher infant mortality and death rates, lower population and growth rates, and changes in the distribution of population by age and sex than would otherwise be expected (July 2015 est.)
Age structure
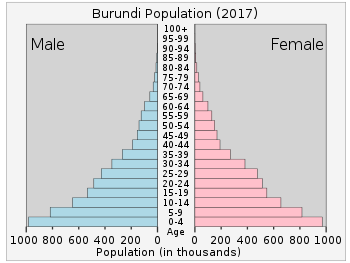
- 0-14 years: 45.52% (male 2,712,836 /female 2,678,223)
- 15-24 years: 19.21% (male 1,135,145 /female 1,139,717)
- 25-54 years: 28.7% (male 1,694,547 /female 1,704,369)
- 55-64 years: 3.89% (male 218,272 /female 242,855)
- 65 years and over: 2.69% (male 137,590 /female 180,966) (2018 est.)
Median age
- total: 17.1 years. Country comparison to the world: 221st
- male: 16.8 years
- female: 17.3 years (2018 est.)
- total: 17 years
- male: 16.8 years
- female: 17.2 years (2015 est.)
Population growth rate
- 3.23% (2018 est.) Country comparison to the world: 4th
- 3.28% (2015 est.)
Total fertility rate
- 5.93 children born/woman (2018 est.) Country comparison to the world: 3rd
Birth rate
- 40.9 births/1,000 population (2018 est.) Country comparison to the world: 7th
Death rate
- 8.6 deaths/1,000 population (2018 est.) Country comparison to the world: 74th
Net migration rate
- 0 migrant(s)/1,000 population (2017 est.) Country comparison to the world: 77th
- 4.04 immigrant(s)/1,000 population (2009 est.)
Population distribution
One of Africa's most densely populated countries; concentrations tend to be in the north and along the northern shore of Lake Tanganyika in the west; most people live on farms near areas of fertile volcanic soil
Urbanization
- Urban population: 13% of total population (2018)
- rate of urbanization: 5.68% annual rate of change (2015-20 est.)
Mother's mean age at first birth
- 21.3 years (2010 est.)
- note: median age at first birth among women 25-29
- Urban population: 12.1% of total population (2015 est.)
- Rate of urbanization: 5.66% annual rate of change (2010- 15 est.)
Sex ratio
- At birth: 1.03 male(s)/female
- Under 15 years: 1.01 male(s)/female
- 15-64 years: 0.99 male(s)/female
- 65 years and over: 0.74 male(s)/female
- Total population: 0.99 male(s)/female (2015 est.)
Life expectancy at birth
- total population: 61.4 years (2018 est.) Country comparison to the world: 203rd
- male: 59.6 years (2018 est.)
- female: 63.2 years (2018 est.)
- Total population: 60.9 years
- Male: 59.2 years
- Female: 62.7 years (2017 est.)
Dependency ratios
- total dependency ratio: 89.6 (2015 est.)
- youth dependency ratio: 84.8 (2015 est.)
- elderly dependency ratio: 4.7 (2015 est.)
- potential support ratio: 21.1 (2015 est.)
Contraceptive prevalence rate
- 28.5% (2016/17)
HIV/AIDS
- Adult prevalence rate: 1.1% (2017 est.)
- People living with HIV/AIDS: 78,000 (2017 est.)
- Deaths: 1,700 (2017 est.)
Children under the age of 5 years underweight
- 29.3% (2016)
Major infectious diseases
- Degree of risk: very high
- Food or waterborne diseases: bacterial diarrhea, hepatitis A, and typhoid fever
- Vectorborne disease: malaria
- Water contact disease: schistosomiasis
- Animal contact disease: rabies (2009)
Nationality
- Noun: Burundian(s)
- Adjective: Burundian
Ethnic groups
Religions
Languages
- Kirundi 29.7% (official), Kirundi and other language 9.1%, French (official) and French and other language 0.3%, Swahili and Swahili and other language 0.2% (along Lake Tanganyika and in the Bujumbura area), English and English and other language 0.06%, more than 2 languages 3.7%, unspecified 56.9% (2008 est.)[9]
Literacy
- Definition: age 15 and over can read and write
- Total population: 85.6%
- Male: 88.2%
- Female: 83.1% (2015 est.)
Education expenditure
- 8.3% of GDP (2009)
References
| Wikimedia Commons has media related to Demographics of Burundi. |
- ""World Population prospects – Population division"". population.un.org. United Nations Department of Economic and Social Affairs, Population Division. Retrieved November 9, 2019.
- ""Overall total population" – World Population Prospects: The 2019 Revision" (xslx). population.un.org (custom data acquired via website). United Nations Department of Economic and Social Affairs, Population Division. Retrieved November 9, 2019.
- "Population Division of the Department of Economic and Social Affairs of the United Nations Secretariat, World Population Prospects: The 2015 Revision". Esa.un.org. Retrieved 2017-08-27.
- "Enquête Démographique et de Santé au Burundi 1987" (PDF). Dhsprogram.com. Retrieved 2017-08-27.
- "Enquête Démographique et de Santé au Burundi ABCD" (PDF). Dhsprogram.com. Retrieved 2017-08-27.
- "World Population Prospects - Population Division - United Nations". esa.un.org. Retrieved 2018-08-26.
- "Burundi Population 2019", World Population Review
- "The World FactBook - Burundi", The World Factbook, July 12, 2018

- "Africa :: BURUNDI". CIA The World Factbook.
![]()