Demographics of Mozambique
The demographics of Mozambique describes the condition and overview of Mozambique's peoples. Demographic topics include basic education, health, and population statistics as well as identified racial and religious affiliations.
Population
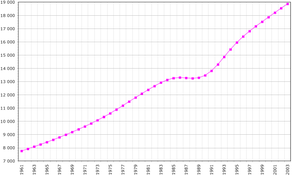
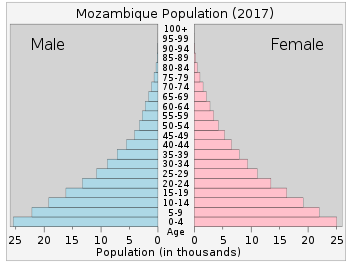
According to the 2019 revision of the World Population Prospects[1][2] the total population was 29,496,004 in 2018, compared to only 6 442 000 in 1950. The proportion of children below the age of 15 in 2010 was 44.1%, 52.6% was between 15 and 65 years of age, while 3.3% was 65 years or older .[3] A population census took place in 2017, and the preliminary results indicate a population of 28 861 863 inhabitants.[4]
| Total population | Population aged 0–14 (%) | Population aged 15–64 (%) | Population aged 65+ (%) | |
|---|---|---|---|---|
| 1950 | 6 442 000 | 41.7 | 55.6 | 2.7 |
| 1955 | 6 972 000 | 41.9 | 55.4 | 2.7 |
| 1960 | 7 647 000 | 42.3 | 55.0 | 2.8 |
| 1965 | 8 474 000 | 42.9 | 54.3 | 2.8 |
| 1970 | 9 453 000 | 43.5 | 53.6 | 2.9 |
| 1975 | 10 620 000 | 43.8 | 53.2 | 3.0 |
| 1980 | 12 146 000 | 43.8 | 53.1 | 3.0 |
| 1985 | 13 335 000 | 44.7 | 52.2 | 3.1 |
| 1990 | 13 547 000 | 46.6 | 50.2 | 3.3 |
| 1995 | 15 933 000 | 44.2 | 52.7 | 3.1 |
| 2000 | 18 201 000 | 43.9 | 53.0 | 3.2 |
| 2005 | 20 770 000 | 44.4 | 52.4 | 3.2 |
| 2010 | 23 391 000 | 44.1 | 52.6 | 3.3 |
Vital statistics
Registration of vital events is in Mozambique not complete. The Population Department of the United Nations prepared the following estimates. [3]
| Period | Live births per year | Deaths per year | Natural change per year | CBR* | CDR* | NC* | TFR* | IMR* |
|---|---|---|---|---|---|---|---|---|
| 1950-1955 | 331 000 | 220 000 | 111 000 | 49.4 | 32.8 | 16.5 | 6.60 | 220 |
| 1955-1960 | 359 000 | 219 000 | 140 000 | 49.1 | 30.0 | 19.1 | 6.60 | 201 |
| 1960-1965 | 392 000 | 222 000 | 170 000 | 48.6 | 27.5 | 21.1 | 6.60 | 185 |
| 1965-1970 | 430 000 | 230 000 | 201 000 | 48.0 | 25.6 | 22.4 | 6.60 | 172 |
| 1970-1975 | 474 000 | 236 000 | 238 000 | 47.2 | 23.5 | 23.7 | 6.58 | 158 |
| 1975-1980 | 534 000 | 247 000 | 288 000 | 46.9 | 21.7 | 25.3 | 6.53 | 146 |
| 1980-1985 | 584 000 | 272 000 | 313 000 | 45.9 | 21.3 | 24.5 | 6.44 | 143 |
| 1985-1990 | 586 000 | 283 000 | 302 000 | 43.6 | 21.1 | 22.5 | 6.33 | 143 |
| 1990-1995 | 640 000 | 293 000 | 347 000 | 43.4 | 19.9 | 23.6 | 6.12 | 134 |
| 1995-2000 | 739 000 | 301 000 | 438 000 | 43.3 | 17.6 | 25.7 | 5.85 | 115 |
| 2000-2005 | 844 000 | 326 000 | 518 000 | 43.3 | 16.7 | 26.6 | 5.52 | 99 |
| 2005-2010 | 869 000 | 341 000 | 528 000 | 39.4 | 15.4 | 23.9 | 5.11 | 88 |
| * CBR = crude birth rate (per 1000); CDR = crude death rate (per 1000); NC = natural change (per 1000); IMR = infant mortality rate per 1000 births; TFR = total fertility rate (number of children per woman) | ||||||||
Also, according to a 2011 survey, the total fertility rate was 5.9 children per woman, with 6.6 in rural areas and 4.5 in urban areas.[5]
Fertility and births
Total Fertility Rate (TFR) (Wanted Fertility Rate) and Crude Birth Rate (CBR):[6][7]
| Year | CBR (Total) | TFR (Total) | CBR (Urban) | TFR (Urban) | CBR (Rural) | TFR (Rural) |
|---|---|---|---|---|---|---|
| 1997 | 5.2 (4.7) | 4.6 (4.1) | 5.3 (4.9) | |||
| 2003 | 40 | 5.5 (4.9) | 31 | 4.4 (3.8) | 49 | 6.1 (5.5) |
| 2011 | 41.6 | 5.9 (5.1) | 37.4 | 4.5 (3.8) | 43.4 | 6.6 (5.8) |
| 2015 | 38.0 | 5.3 | 30.8 | 3.6 | 41.2 | 6.1 |
| 2018 | 37.5 | 5.4 | 31.2 | 3.9 | 40.2 | 6.2 |
Fertility data by province (DHS Program):[8][7]
| Province | Total fertility rate (2011) |
Total fertility rate (2015) |
Total fertility rate (2018) |
|---|---|---|---|
| Niassa | 7.1 | 6.6 | 6.4 |
| Cabo Delgado | 6.6 | 5.6 | 6.1 |
| Nampula | 6.1 | 5.2 | 6.0 |
| Zambézia | 6.8 | 6.3 | 6.2 |
| Tete | 6.8 | 6.2 | 6.0 |
| Manica | 5.8 | 6.2 | 5.8 |
| Sofala | 6.1 | 6.0 | 6.4 |
| Inhambane | 4.9 | 4.3 | 4.1 |
| Gaza | 5.3 | 4.7 | 4.1 |
| Maputo Província | 4.1 | 3.4 | 3.0 |
| Maputo Cidade | 3.1 | 2.5 | 2.2 |
Life expectancy
| Period | Life expectancy in Years[9] |
|---|---|
| 1950–1955 | 31.29 |
| 1955–1960 | |
| 1960–1965 | |
| 1965–1970 | |
| 1970–1975 | |
| 1975–1980 | |
| 1980–1985 | |
| 1985–1990 | |
| 1990–1995 | |
| 1995–2000 | |
| 2000–2005 | |
| 2005–2010 | |
| 2010–2015 |
Ethnic groups
Mozambique's major ethnic groups encompass numerous subgroups with diverse languages, dialects, cultures, and histories. Many are linked to similar ethnic groups living in inland countries. The estimated 4 million Makua are the largest ethnic group of the country and are dominant in the northern part of the country — the Sena and Shona (mostly Ndau-Shangaan) are prominent in the Zambezi valley, and the Shangaan (Tsonga) dominate in southern Mozambique. Other groups include Makonde, Yao, Swahili, Tonga, Chopi, and Nguni (including Zulu). The country is also home to a growing number of white residents, most with Portuguese ancestry.[11] During colonial rule, European residents hailed from every Mozambican province, and at the time of independence the total population was estimated at around 360,000. Most vacated the region after independence in 1975, emigrating to Portugal as retornados. There is also a larger mestiço minority with mixed African and Portuguese heritage. The remaining non-Blacks in Mozambique are primarily Indian Asiatics, who have arrived from Pakistan, Portuguese India, and numerous Arab countries. There are various estimates for the size of Mozambique's Chinese community, ranging from 1,500 to 12,000 as of 2007.[12][13]
Languages
Portuguese is the official and most widely spoken language of the nation, but in 2017 only 47.4% of Mozambique's population speak Portuguese as either their first or second language, and only 16.6% speak Portuguese as their first language.[14] Arabs, Chinese, and Indians speak their own languages (Indians from Portuguese India speak any of the Portuguese Creoles of their origin) aside from Portuguese as their second language. Most educated Mozambicans speak English, which is used in schools and business as second or third language.
Religion
Culture
Despite the influence of Islamic coastal traders and European colonizers, the people of Mozambique have largely retained an indigenous culture based on smallscale agriculture. Mozambique's most highly developed art forms have been wood sculpture, for which the Makonde in northern Mozambique are particularly renowned, and dance. The middle and upper classes continue to be heavily influenced by the Portuguese colonial and linguistic heritage.
Education and health
Under Portugal, educational opportunities for poor Mozambicans were limited; 93% of the Bantu population was illiterate, and many could not speak Portuguese. In fact, most of today's political leaders were educated in missionary schools. After independence, the government placed a high priority on expanding education, which reduced the illiteracy rate to about two-thirds as primary school enrollment increased. Unfortunately, in recent years school construction and teacher training enrollments have not kept up with population increases. With post-war enrollments reaching all-time highs, the quality of education has suffered. As a member of Commonwealth of Nations, most urban Mozambicans are required to learn English starting high-school.
Other demographic statistics
Demographic statistics according to the World Population Review in 2019.[16]
- One birth every 27 seconds
- One death every 2 minutes
- One net migrant every 103 minutes
- Net gain of one person every 36 seconds
The following demographic are from the CIA World Factbook[17] unless otherwise indicated.[18]
Population
- 27,233,789 (July 2018 est.)
Age structure
- 0-14 years: 44.52% (male 6,097,116 /female 6,028,416)
- 15-24 years: 21.6% (male 2,905,254 /female 2,977,732)
- 25-54 years: 27.62% (male 3,525,755 /female 3,995,264)
- 55-64 years: 3.37% (male 442,990 /female 475,900)
- 65 years and over: 2.88% (male 359,624 /female 425,738) (2018 est.)
Birth rate
- 37.8 births/1,000 population (2018 est.) Country comparison to the world: 11th
Death rate
- 11.4 deaths/1,000 population (2018 est.)
Total fertility rate
- 5.02 children born/woman (2018 est.) Country comparison to the world: 12th
Median age
- total: 17.3 years. Country comparison to the world: 220th
- male: 16.7 years
- female: 17.8 years (2018 est.)
Population growth rate
- 2.46% (2018 est.) Country comparison to the world: 25th
Mother's mean age at first birth
- 18.9 years (2011 est.)
- median age at first birth among women 25-29
Contraceptive prevalence rate
- 27.1% (2015)
Net migration rate
- -1.9 migrant(s)/1,000 population (2017 est.) Country comparison to the world: 160th
Urbanization
- urban population: 36% of total population (2018)
- rate of urbanization: 4.35% annual rate of change (2015-20 est.)
Net migration rate
- -1.9 migrants/1,000 population (2017)
Dependency ratios
- total dependency ratio: 93.5 (2015 est.)
- youth dependency ratio: 87.5 (2015 est.)
- elderly dependency ratio: 6.1 (2015 est.)
- potential support ratio: 16.5 (2015 est.)
Sex ratio
at birth: 1.03 male(s)/female (2003 est.), 1.02 male(s)/female (2007 est.)
under 15 years: 0.98 male(s)/female (2003 est.), 1.01 male(s)/female (2007 est.)
15-64 years: 0.95 male(s)/female (2003 est.), 0.949 male(s)/female (2007 est.)
65 years and over: 0.7 male(s)/female (2003 est.), 0.717 male(s)/female (2007 est.)
total population: 0.96 male(s)/female (2003 est.), 0.968 male(s)/female (2007 est.)
Life expectancy at birth
- total population: 54.1 years
- male: 53.3 years
- female: 54.9 years (2018 est.)
HIV/AIDS — people living with HIV/AIDS: 2.1 million (2017 est.) HIV/AIDS — deaths: 70,000 (2017 est.)
Nationality
noun:
Mozambican(s)
adjective:
Mozambican
Ethnic groups
Indigenous tribal groups (including the Shangana, Chokwe, Manyika, Sena, Makua, Ndau, among others) make up 98.61% of Mozambique's total population. People of mixed race are the largest minority, totaling 0.84% from the remaining figure, while Portuguese Mozambicans and Mozambicans of Indian descent represent 0.36% and 0.2% of the population respectively . There are noteworthy Chinese and Arab communities.
Languages
Portuguese language (official)
Emakhuwa 26.1%, Xichangana 11.3%, Portuguese 8.8% (official; spoken by 27% of population as a second language), Elomwe 7.6%, Cisena 6.8%, Echuwabo 5.8%, other Mozambican languages 32%, other foreign languages 0.3%, unspecified 1.3% (1997 census)
Literacy
definition: age 15 and over can read and write (2015 est.)
- total population: 56% (2015 est.)
- male: 70.8% (2015 est.)
- female: 43.1% (2015 est.)
- total population: 47.8% (2003 est.), 40.1% (1995 est.)
- male: 63.5% (2003 est.), 57.7% (1995 est.)
- female: 32.7% (2003 est.), 23.3% (1995 est.)
School life expectancy (primary to tertiary education)
- total: 10 years (2017)
- male: 10 years (2017)
- female: 9 years (2017)
Unemployment, youth ages 15-24
- total: 7.4% (2015 est.)
- male: 7.7% (2015 est.)
- female: 7.1% (2015 est.)
References
- ""World Population prospects – Population division"". population.un.org. United Nations Department of Economic and Social Affairs, Population Division. Retrieved November 9, 2019.
- ""Overall total population" – World Population Prospects: The 2019 Revision" (xslx). population.un.org (custom data acquired via website). United Nations Department of Economic and Social Affairs, Population Division. Retrieved November 9, 2019.
- Population Division of the Department of Economic and Social Affairs of the United Nations Secretariat, World Population Prospects: The 2010 Revision Archived May 6, 2011, at the Wayback Machine
- "Census shows Mozambique has 28.9 million inhabitants". 2018-01-04. Retrieved 2018-09-04.
- "Moçambique Inquérito Demográfico e de Saúde 2011" (PDF). Moçambique Inquérito Demográfico e de Saúde. 2011.
- "MEASURE DHS: Demographic and Health Surveys". microdata.worldbank.org.
- "STATcompiler". www.statcompiler.com. Retrieved 2020-02-17.
- "Demographics" (PDF). Moçambique Inquérito Demográfico e de Saúde.
- "World Population Prospects - Population Division - United Nations". esa.un.org. Retrieved 2018-08-26.
- "Africa :: MOZAMBIQUE". CIA The World Factbook.
- Tay, Nastasya (22 December 2011). "Portugal's migrants hope for new life in old African colony" – via The Guardian.
- Jian, Hong (2007), "莫桑比克华侨的历史与现状 (The History and Status Quo of Overseas Chinese in Mozambique)", West Asia and Africa, Chinese Academy of Social Sciences (5), ISSN 1002-7122, archived from the original on 2011-06-17, retrieved 2008-10-29
- Horta, Loro (2007-08-13), "China, Mozambique: old friends, new business", International Relations and Security Network Update, retrieved 2007-11-03
- "LUSOFONIA EM MOÇAMBIQUE:COM OU SEM GLOTOFAGIA?" (PDF). II CONGRESSO INTERNACIONAL DE LINGUÍSTICA HISTÓRICA HOMENAGEM A ATALIBA TEIXEIRA DE CASTILHO. Archived from the original (PDF) on 2015-04-12.
- "Moçambique: Inquérito de Indicadores de Imunização, Malária e HIV/SIDA em Moçambique (IMASIDA), 2015" (PDF) (in Portuguese). Ministério da Saúde & Instituto Nacional de Estatística. p. 40. Retrieved 20 April 2018.
- "Mozambique Population 2019", World Population Review
- "The World FactBook - Mozambique", The World Factbook, July 12, 2018

- "CIA - The World Factbook -- Mozambique". www.umsl.edu.
| Wikimedia Commons has media related to Demographics of Mozambique. |
![]()
| History |  | ||
|---|---|---|---|
| Geography | |||
| Politics |
| ||
| Economy | |||
| Society |
| ||