1994 Wirral Metropolitan Borough Council election
The 1994 Wirral Metropolitan Borough Council election took place on 5 May 1994 to elect members of Wirral Metropolitan Borough Council in England.[2] This election was held on the same day as other local elections.
| |||||||||||||||||||||||||||||||||||||||||||||||||
24 of 66 seats (One Third and two by-elections) to Wirral Metropolitan Borough Council 34 seats needed for a majority | |||||||||||||||||||||||||||||||||||||||||||||||||
|---|---|---|---|---|---|---|---|---|---|---|---|---|---|---|---|---|---|---|---|---|---|---|---|---|---|---|---|---|---|---|---|---|---|---|---|---|---|---|---|---|---|---|---|---|---|---|---|---|---|
| Turnout | 43.0% ( | ||||||||||||||||||||||||||||||||||||||||||||||||
| |||||||||||||||||||||||||||||||||||||||||||||||||
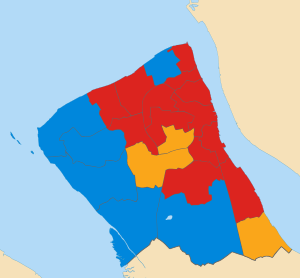
 Map of results of 1994 election | |||||||||||||||||||||||||||||||||||||||||||||||||
| |||||||||||||||||||||||||||||||||||||||||||||||||
After the election, the composition of the council was:
| Party | Seats | ± | |
|---|---|---|---|
| Labour | 30 | ||
| Conservative | 28 | ||
| Liberal Democrats | 8 | ||
Election results
Overall election result
Overall result compared with 1992.
| Wirral Metropolitan Borough Council election results, 1994 | |||||||||||||||
|---|---|---|---|---|---|---|---|---|---|---|---|---|---|---|---|
| Party | Candidates | Votes | |||||||||||||
| Stood | Elected | Gained | Unseated | Net | % of total | % | No. | Net % | |||||||
| Labour | 24 | 15 | 1 | 1 | 59.1 | 46.6 | 50,381 | ||||||||
| Conservative | 24 | 6 | 0 | 2 | 27.3 | 30.8 | 33,283 | ||||||||
| Liberal Democrats | 23 | 3 | 2 | 0 | 13.6 | 22.5 | 24,288 | ||||||||
| Green | 1 | 0 | 0 | 0 | 0.0 | 0.1 | 135 | ||||||||
Ward results
Bebington
| Party | Candidate | Votes | % | ± | |
|---|---|---|---|---|---|
| Labour | Kathryn Shaughnessy | 2,344 | 43.3 | ||
| Conservative | A. Green | 2,242 | 41.4 | ||
| Liberal Democrats | Kevin Turner | 830 | 15.3 | ||
| Majority | 102 | 1.9 | N/A | ||
| Registered electors | 10,839 | ||||
| Turnout | 50.0 | ||||
| Labour gain from Conservative | Swing | ||||
Bidston
| Party | Candidate | Votes | % | ± | |
|---|---|---|---|---|---|
| Labour | William Nock | 2,302 | 83.8 | ||
| Liberal Democrats | Francis Doyle | 257 | 9.4 | ||
| Conservative | M. Vickers | 189 | 6.9 | New | |
| Majority | 2,045 | 74.4 | |||
| Registered electors | 8,560 | ||||
| Turnout | 32.1 | ||||
| Labour hold | Swing | ||||
Birkenhead
| Party | Candidate | Votes | % | ± | |
|---|---|---|---|---|---|
| Labour | David Christian | 3,107 | 84.4 | ||
| Liberal Democrats | P. Cooke | 303 | 8.2 | ||
| Conservative | B. Brassey | 270 | 7.3 | ||
| Majority | 2,804 | 76.2 | |||
| Registered electors | 10,532 | ||||
| Turnout | 34.9 | ||||
| Labour hold | Swing | ||||
Bromborough
| Party | Candidate | Votes | % | ± | |
|---|---|---|---|---|---|
| Labour | A. Witter | 2,823 | 61.6 | ||
| Conservative | K. Roberts | 984 | 21.5 | ||
| Liberal Democrats | L. Smith | 775 | 16.9 | ||
| Majority | 1,839 | 40.1 | |||
| Registered electors | 11,227 | ||||
| Turnout | 40.8 | ||||
| Labour hold | Swing | ||||
Clatterbridge
| Party | Candidate | Votes | % | ± | |
|---|---|---|---|---|---|
| Conservative | Myrra Lea | 2,794 | 43.5 | ||
| Labour | Audrey Moore | 2,024 | 31.5 | ||
| Liberal Democrats | W. Walsh | 1,612 | 25.1 | ||
| Majority | 770 | 12.0 | |||
| Registered electors | 14,165 | ||||
| Turnout | 45.4 | ||||
| Conservative hold | Swing | ||||
Claughton
| Party | Candidate | Votes | % | ± | |
|---|---|---|---|---|---|
| Labour | Stephen Foulkes | 2,653 | 53.3 | ||
| Liberal Democrats | Freda Anderson | 1,616 | 32.4 | ||
| Conservative | P. Greening-Jackson | 711 | 14.3 | ||
| Majority | 1,037 | 20.8 | |||
| Registered electors | 10,732 | ||||
| Turnout | 46.4 | ||||
| Labour hold | Swing | ||||
Eastham
| Party | Candidate | Votes | % | ± | |
|---|---|---|---|---|---|
| Liberal Democrats | Thomas Harney | 3,019 | 54.3 | ||
| Labour | Ann McLachlan | 1,761 | 31.7 | ||
| Conservative | A. Drury | 780 | 14.0 | ||
| Majority | 1,258 | 22.6 | |||
| Registered electors | 11,576 | ||||
| Turnout | 48.0 | ||||
| Liberal Democrats gain from Conservative | Swing | ||||
Egerton
| Party | Candidate | Votes | % | ± | |
|---|---|---|---|---|---|
| Labour | Barney Gilfoyle | 3,084 | 71.7 | ||
| Conservative | Cyrus Ferguson | 698 | 16.2 | ||
| Liberal Democrats | A. Molyneux | 520 | 12.1 | ||
| Majority | 2,386 | 55.5 | |||
| Registered electors | 10,852 | ||||
| Turnout | 39.6 | ||||
| Labour hold | Swing | ||||
Heswall
| Party | Candidate | Votes | % | ± | |
|---|---|---|---|---|---|
| Conservative | Andrew Hodson | 3,268 | 58.0 | ||
| Liberal Democrats | Edward Norton | 1,427 | 25.3 | ||
| Labour | L. Flanagan | 941 | 16.7 | ||
| Majority | 1,841 | 32.7 | |||
| Registered electors | 13,326 | ||||
| Turnout | 42.3 | ||||
| Conservative hold | Swing | ||||
Hoylake
| Party | Candidate | Votes | % | ± | |
|---|---|---|---|---|---|
| Conservative | J. Stedmon | 3,049 | 57.6 | ||
| Liberal Democrats | A. Richards | 1,183 | 22.3 | ||
| Labour | Adrian Jones | 1,062 | 20.1 | ||
| Majority | 1,866 | 35.2 | |||
| Registered electors | 12,619 | ||||
| Turnout | 42.0 | ||||
| Conservative hold | Swing | ||||
Leasowe
| Party | Candidate | Votes | % | ± | |
|---|---|---|---|---|---|
| Labour | Paul O'Connor [n 2] | 2,455 | 71.7 | ||
| Labour | M. Davies [n 3] | 2,239 | – | – | |
| Labour | M. Keenan [n 4] | 2,192 | – | – | |
| Conservative | G. Beattie | 587 | 17.1 | ||
| Conservative | Geoffrey Caton | 575 | – | – | |
| Conservative | B. Howden | 535 | – | – | |
| Liberal Democrats | B. Thomas | 382 | 11.2 | ||
| Liberal Democrats | Moira Gallagher | 337 | – | – | |
| Liberal Democrats | B. Price | 295 | – | – | |
| Majority | 1,868 | 54.6 | |||
| Registered electors | 9,598 | ||||
| Turnout | 35.7 | ||||
| Labour hold | Swing | ||||
| Labour hold | Swing | – | |||
| Labour hold | Swing | – | |||
Liscard
| Party | Candidate | Votes | % | ± | |
|---|---|---|---|---|---|
| Labour | Gordon Paterson | 3,020 | 61.0 | ||
| Conservative | P. Buzzard | 1,334 | 26.9 | ||
| Liberal Democrats | M. Todd | 596 | 12.0 | ||
| Majority | 1,686 | 34.1 | N/A | ||
| Registered electors | 11,297 | ||||
| Turnout | 43.8 | ||||
| Labour hold | Swing | ||||
Moreton
| Party | Candidate | Votes | % | ± | |
|---|---|---|---|---|---|
| Labour | M. Groves | 2,763 | 57.5 | ||
| Conservative | Patricia Jones | 1,621 | 33.7 | ||
| Liberal Democrats | Susanne Uriel | 423 | 8.8 | ||
| Majority | 1,142 | 23.8 | N/A | ||
| Registered electors | 9,596 | ||||
| Turnout | 50.1 | ||||
| Labour hold | Swing | ||||
New Brighton
| Party | Candidate | Votes | % | ± | |
|---|---|---|---|---|---|
| Labour | Patrick Hackett | 2,606 | 51.2 | ||
| Conservative | N. Joynson | 1,639 | 32.2 | ||
| Liberal Democrats | John Codling | 841 | 16.5 | ||
| Majority | 967 | 19.0 | N/A | ||
| Registered electors | 11,502 | ||||
| Turnout | 44.2 | ||||
| Labour hold | Swing | ||||
Oxton
| Party | Candidate | Votes | % | ± | |
|---|---|---|---|---|---|
| Liberal Democrats | Gordon Lindsay | 3,087 | 58.6 | ||
| Labour | Keith Williams | 1,345 | 25.6 | ||
| Conservative | Vera Ruck [n 5] | 832 | 15.8 | ||
| Majority | 1,742 | 33.1 | |||
| Registered electors | 11,836 | ||||
| Turnout | 44.5 | ||||
| Liberal Democrats hold | Swing | ||||
Prenton
| Party | Candidate | Votes | % | ± | |
|---|---|---|---|---|---|
| Liberal Democrats | John Thornton | 3,239 | 50.3 | ||
| Labour | John Cocker | 1,643 | 25.5 | ||
| Conservative | D. Morton | 1,554 | 24.1 | ||
| Majority | 1,596 | 24.8 | N/A | ||
| Registered electors | 11,707 | ||||
| Turnout | 55.0 | ||||
| Liberal Democrats gain from Labour | Swing | ||||
Royden
| Party | Candidate | Votes | % | ± | |
|---|---|---|---|---|---|
| Conservative | Laurence Jones | 2,683 | 51.2 | ||
| Labour | R. Pennington | 1,337 | 25.5 | ||
| Liberal Democrats | Peter Reisdorf | 1,219 | 23.3 | ||
| Majority | 1,346 | 25.7 | |||
| Registered electors | 12,658 | ||||
| Turnout | 41.4 | ||||
| Conservative hold | Swing | ||||
Seacombe
| Party | Candidate | Votes | % | ± | |
|---|---|---|---|---|---|
| Labour | J. Jackson | 3,443 | 79.1 | ||
| Conservative | B. Bartlett | 503 | 11.6 | ||
| Liberal Democrats | M. Wright | 407 | 9.3 | ||
| Majority | 2,940 | 67.5 | |||
| Registered electors | 11,232 | ||||
| Turnout | 38.8 | ||||
| Labour hold | Swing | ||||
Thurstaston
| Party | Candidate | Votes | % | ± | |
|---|---|---|---|---|---|
| Conservative | Mark Hughes | 3,049 | 60.2 | ||
| Labour | Denis Knowles | 2,012 | 39.8 | ||
| Majority | 1,037 | 20.5 | |||
| Registered electors | 12,580 | ||||
| Turnout | 40.2 | ||||
| Conservative hold | Swing | ||||
Tranmere
| Party | Candidate | Votes | % | ± | |
|---|---|---|---|---|---|
| Labour | William Davies | 2,790 | 81.8 | ||
| Liberal Democrats | Stephen Blaylock | 273 | 7.9 | ||
| Conservative | C. Bowditch | 243 | 7.1 | ||
| Green | Nigel Birchenough | 135 | 3.9 | ||
| Majority | 2,517 | 73.1 | |||
| Registered electors | 9,868 | ||||
| Turnout | 34.9 | ||||
| Labour hold | Swing | ||||
Upton
| Party | Candidate | Votes | % | ± | |
|---|---|---|---|---|---|
| Labour | Hugh Lloyd | 3,136 | 53.9 | ||
| Conservative | D. Smith | 1,782 | 30.6 | ||
| Liberal Democrats | E. Davies | 902 | 15.5 | ||
| Majority | 1,354 | 23.3 | N/A | ||
| Registered electors | 12,908 | ||||
| Turnout | 45.1 | ||||
| Labour hold | Swing | ||||
Wallasey
| Party | Candidate | Votes | % | ± | |
|---|---|---|---|---|---|
| Conservative | Michael Howden | 2,471 | 44.3 | ||
| Labour | A. Sheppard | 1,730 | 31.0 | ||
| Liberal Democrats | John Uriel | 1,377 | 24.7 | ||
| Majority | 741 | 13.3 | |||
| Registered electors | 11,998 | ||||
| Turnout | 46.5 | ||||
| Conservative hold | Swing | ||||
Notes
• italics denote the sitting councillor • bold denotes the winning candidate
- % of total refers to % of wards won.
- Elected to serve a 4-year term.
- Elected to serve a 2-year term.
- Elected to serve a 1-year term.
- Incumbent councillor for Eastham ward.
gollark: The Nim compiler is actually 4.5MB, which is 1.2MB bigger than minoteaur compiled in debug mode.
gollark: TCC is apparently only 252KB.
gollark: * "bee!"
gollark: Yůr thing prints "bee"?
gollark: IntelliJ IDEA.
References
- "Local Election Summaries 1994". The Elections Centre. Retrieved 17 January 2019.
- "Metropolitan Borough of Wirral Election Results 1973-2012 (Pg. 12 and 13)" (PDF). The Elections Centre. Retrieved 17 January 2019.
- "Council compositions". The Elections Centre. Retrieved 27 July 2018.
- "Councillor Steve Foulkes". Wirral Metropolitan Borough Council.
- "Councillor Tom Harney". Wirral Metropolitan Borough Council.
- "Councillor Ann McLachlan". Wirral Metropolitan Borough Council.
- "Councillor Andrew Hodson". Wirral Metropolitan Borough Council.
- "Councillor Adrian Jones". Wirral Metropolitan Borough Council.
- "Councillor Pat Hackett". Wirral Metropolitan Borough Council.
- "Councillor Jerry Williams". Wirral Metropolitan Borough Council.
- "Councillor Peter Reisdorf". Wirral Metropolitan Borough Council.
- "Councillor Denis Knowles". Wirral Metropolitan Borough Council.
- "Councillor Bill Davies". Wirral Metropolitan Borough Council.
Mellows-Facer, Adam (10 May 2006). "Local election 2006". parliament.uk. Retrieved 29 December 2018.
"BBC NEWS VOTE 2003 WIRRAL". BBC News. 1 May 2003. Retrieved 29 December 2018.
This article is issued from Wikipedia. The text is licensed under Creative Commons - Attribution - Sharealike. Additional terms may apply for the media files.

