2012 Wirral Metropolitan Borough Council election
The 2012 Wirral Metropolitan Borough Council election took place on 3 May 2012 to elect members of Wirral Metropolitan Borough Council in England.[1] This election was held on the same day as other local elections.
| |||||||||||||||||||||||||||||||||||||||||||||||||
22 of 66 seats (One Third) to Wirral Metropolitan Borough Council 34 seats needed for a majority | |||||||||||||||||||||||||||||||||||||||||||||||||
|---|---|---|---|---|---|---|---|---|---|---|---|---|---|---|---|---|---|---|---|---|---|---|---|---|---|---|---|---|---|---|---|---|---|---|---|---|---|---|---|---|---|---|---|---|---|---|---|---|---|
| Turnout | 36.4% ( | ||||||||||||||||||||||||||||||||||||||||||||||||
| |||||||||||||||||||||||||||||||||||||||||||||||||
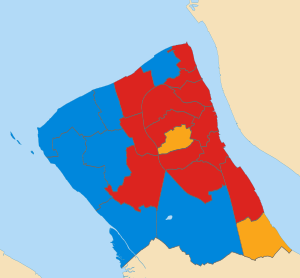 Map of results of 2012 election | |||||||||||||||||||||||||||||||||||||||||||||||||
| |||||||||||||||||||||||||||||||||||||||||||||||||
Overall, Labour gained seven seats at the expense of the Conservatives and Liberal Democrats and gained overall control of the council, with a majority of eight.[2]
After the election, the composition of the council was:
| Party | Seats | ± | |
|---|---|---|---|
| Labour | 37 | ||
| Conservative | 22 | ||
| Liberal Democrat | 7 | ||
Election results
Overall election result
Overall result compared with 2011.
| Wirral Metropolitan Borough Council election result, 2012 | |||||||||||||||
|---|---|---|---|---|---|---|---|---|---|---|---|---|---|---|---|
| Party | Candidates | Votes | |||||||||||||
| Stood | Elected | Gained | Unseated | Net | % of total | % | No. | Net % | |||||||
| Labour | 22 | 13 | 7 | 0 | 59.1 | 44.6 | 38,455 | ||||||||
| Conservative | 22 | 7 | 0 | 5 | 31.8 | 30.6 | 26,426 | ||||||||
| Liberal Democrats | 16 | 2 | 0 | 2 | 9.1 | 10.9 | 9,375 | ||||||||
| UKIP | 22 | 0 | 0 | 0 | 0.0 | 7.4 | 6,378 | ||||||||
| Green | 22 | 0 | 0 | 0 | 0.0 | 5.9 | 5,064 | ||||||||
| Independent | 3 | 0 | 0 | 1 | 0.0 | 0.4 | 364 | ||||||||
| TUSC | 1 | 0 | 0 | 0 | 0.0 | 0.2 | 130 | N/A | |||||||
| BNP | 1 | 0 | 0 | 0 | 0.0 | 0.1 | 61 | N/A | |||||||
Changes in council composition
Prior to the election the composition of the council was:
| 30 | 27 | 9 |
| Lab | Con | LD |
After the election the composition of the council was:
| 37 | 21 | 7 |
| Lab | Con | LD |
Ward results
Results compared directly with the last local election in 2011.
Bebington
| Party | Candidate | Votes | % | ± | |
|---|---|---|---|---|---|
| Labour | Christina Muspratt | 2,572 | 53.8 | ||
| Conservative | Sheila Clarke | 1,513 | 31.6 | ||
| UKIP | Hilary Jones | 386 | 8.1 | ||
| Green | Michael Harper | 173 | 3.6 | ||
| Liberal Democrats | Peter Faulkner | 40 | 2.9 | New | |
| Majority | 1,059 | 22.2 | |||
| Registered electors | 11,886 | ||||
| Turnout | 40.4 | ||||
| Labour gain from Conservative | Swing | ||||
Bidston and St James
| Party | Candidate | Votes | % | ± | |
|---|---|---|---|---|---|
| Labour | Jim Crabtree | 1,992 | 78.2 | ||
| Conservative | Peter Dawson | 179 | 7.0 | ||
| UKIP | Helen Romnes | 136 | 5.3 | ||
| Green | Colin Dignam-Gill | 85 | 3.3 | New | |
| Independent | John Brace | 82 | 3.2 | New | |
| Liberal Democrats | Peter Faulkner | 73 | 2.9 | ||
| Majority | 1,813 | 71.2 | |||
| Registered electors | 9,817 | ||||
| Turnout | 26.0 | ||||
| Labour hold | Swing | ||||
Birkenhead and Tranmere
| Party | Candidate | Votes | % | ± | |
|---|---|---|---|---|---|
| Labour | Jean Stapleton | 1,474 | 49.7 | ||
| Green | Pat Cleary | 1,215 | 41.0 | ||
| UKIP | David Martin | 99 | 3.3 | ||
| Liberal Democrats | Allan Brame | 61 | 2.1 | ||
| BNP | Joe Killen | 61 | 2.1 | New | |
| Conservative | June Cowin | 54 | 1.8 | ||
| Majority | 259 | 8.7 | |||
| Registered electors | 9,527 | ||||
| Turnout | 31.2 | ||||
| Labour hold | Swing | ||||
Bromborough
| Party | Candidate | Votes | % | ± | |
|---|---|---|---|---|---|
| Labour | Steve Niblock | 2,292 | 64.8 | ||
| Conservative | Kathryn Hodson | 466 | 13.2 | ||
| UKIP | Timothy Pass | 298 | 8.4 | ||
| Liberal Democrats | Penelope Golby | 296 | 8.4 | ||
| Green | Percy Hogg | 187 | 5.3 | ||
| Majority | 1,826 | 51.6 | |||
| Registered electors | 10,969 | ||||
| Turnout | 32.4 | ||||
| Labour hold | Swing | ||||
Clatterbridge
| Party | Candidate | Votes | % | ± | |
|---|---|---|---|---|---|
| Conservative | Cherry Povall | 2,220 | 47.0 | ||
| Labour | Phillip Brightmore | 1,623 | 34.4 | ||
| UKIP | Roger Jones | 370 | 7.8 | ||
| Liberal Democrats | Simon Thomson | 337 | 7.1 | ||
| Green | Jim McGinley | 174 | 3.7 | ||
| Majority | 597 | 12.6 | |||
| Registered electors | 11,640 | ||||
| Turnout | 40.7 | ||||
| Conservative hold | Swing | ||||
Claughton
| Party | Candidate | Votes | % | ± | |
|---|---|---|---|---|---|
| Labour | George Davies | 2,367 | 65.6 | ||
| Conservative | Barbara Sinclair | 575 | 15.9 | ||
| UKIP | Bethan Williams | 304 | 8.4 | ||
| Liberal Democrats | Christopher Teggin | 187 | 5.2 | ||
| Green | Cathy Page | 177 | 4.9 | ||
| Majority | 1,792 | 49.7 | |||
| Registered electors | 11,054 | ||||
| Turnout | 32.7 | ||||
| Labour hold | Swing | ||||
Eastham
| Party | Candidate | Votes | % | ± | |
|---|---|---|---|---|---|
| Liberal Democrats | Phillip Gilchrist | 2,151 | 50.2 | ||
| Labour | Mike Thompson | 1,539 | 36.0 | ||
| Conservative | Kevin Sharkey | 315 | 7.4 | ||
| UKIP | Laurence Jones | 219 | 5.1 | ||
| Green | Jackie Smith | 55 | 1.3 | New | |
| Majority | 612 | 14.3 | |||
| Registered electors | 10,964 | ||||
| Turnout | 39.2 | ||||
| Liberal Democrats hold | Swing | ||||
Greasby, Frankby and Irby
| Party | Candidate | Votes | % | ± | |
|---|---|---|---|---|---|
| Conservative | Tony Cox | 1,820 | 37.3 | ||
| Liberal Democrats | Peter Reisdorf | 1,277 | 26.1 | ||
| Labour | Lee Rushworth | 1,159 | 23.7 | ||
| UKIP | Derek Snowden | 421 | 8.6 | ||
| Green | Rachel Markey | 208 | 4.3 | ||
| Majority | 543 | 11.2 | |||
| Registered electors | 11,485 | ||||
| Turnout | 42.6 | ||||
| Conservative hold | Swing | ||||
Heswall
| Party | Candidate | Votes | % | ± | |
|---|---|---|---|---|---|
| Conservative | Peter Johnson | 2,766 | 62.7 | ||
| Labour | Audrey Moore | 785 | 17.8 | ||
| UKIP | David Scott | 413 | 9.4 | ||
| Green | Barbara Burton | 261 | 5.9 | ||
| Liberal Democrats | David Tyrrell | 186 | 4.2 | ||
| Majority | 1,981 | 44.9 | |||
| Registered electors | 10,926 | ||||
| Turnout | 40.5 | ||||
| Conservative hold | Swing | ||||
Hoylake and Meols
| Party | Candidate | Votes | % | ± | |
|---|---|---|---|---|---|
| Conservative | John Hale | 2,134 | 53.6 | ||
| Labour | Alan Milne | 1,056 | 26.5 | ||
| Liberal Democrats | Joseph McDowell | 187 | 4.7 | ||
| Green | Yvonne McGinley | 334 | 8.4 | ||
| UKIP | George Robinson | 274 | 6.9 | ||
| Majority | 1,078 | 27.1 | |||
| Registered electors | 10,327 | ||||
| Turnout | 38.8 | ||||
| Conservative hold | Swing | ||||
Leasowe and Moreton East
| Party | Candidate | Votes | % | ± | |
|---|---|---|---|---|---|
| Labour | Anita Leech | 2,094 | 51.0 | ||
| Conservative | Ian Lewis | 1,776 | 43.3 | ||
| UKIP | Catherine Williams | 144 | 3.5 | ||
| Green | Cynthia Stonall | 89 | 2.2 | ||
| Majority | 318 | 7.7 | |||
| Registered electors | 10,466 | ||||
| Turnout | 39.3 | ||||
| Labour gain from Conservative | Swing | ||||
Liscard
| Party | Candidate | Votes | % | ± | |
|---|---|---|---|---|---|
| Labour | Janette Williamson | 1,882 | 49.9 | ||
| Conservative | James Keeley | 1,261 | 33.4 | ||
| UKIP | Lynda Williams | 400 | 10.6 | ||
| Green | Kenneth Peers | 230 | 6.1 | ||
| Majority | 621 | 16.5 | |||
| Registered electors | 10,991 | ||||
| Turnout | 34.5 | ||||
| Labour gain from Conservative | Swing | ||||
Moreton West and Saughall Massie
| Party | Candidate | Votes | % | ± | |
|---|---|---|---|---|---|
| Conservative | Chris Blakeley | 2,269 | 57.4 | ||
| Labour | Karl Greaney | 1,369 | 34.6 | ||
| UKIP | Susan Whitham | 223 | 5.6 | ||
| Green | Perle Sheldricks | 95 | 2.4 | ||
| Majority | 900 | 22.8 | |||
| Registered electors | 10,655 | ||||
| Turnout | 37.2 | ||||
| Conservative hold | Swing | ||||
New Brighton
| Party | Candidate | Votes | % | ± | |
|---|---|---|---|---|---|
| Labour | Robert Gregson | 1,908 | 52.8 | ||
| Conservative | Sue Taylor | 1,032 | 28.5 | ||
| UKIP | Bill Duffey | 366 | 10.1 | ||
| Green | James Brady | 309 | 8.5 | ||
| Majority | 876 | 24.3 | |||
| Registered electors | 10,669 | ||||
| Turnout | 34.0 | ||||
| Labour gain from Conservative | Swing | ||||
Oxton
| Party | Candidate | Votes | % | ± | |
|---|---|---|---|---|---|
| Liberal Democrats | Pat Williams | 2,026 | 45.8 | ||
| Labour | Matthew Patrick | 1,763 | 39.8 | ||
| UKIP | Philip Grittiths | 258 | 5.8 | ||
| Conservative | Tina McDonnell | 232 | 5.2 | ||
| Green | Elisabeth Heydon | 149 | 3.4 | ||
| Majority | 263 | 6.0 | |||
| Registered electors | 11,140 | ||||
| Turnout | 39.9 | ||||
| Liberal Democrats hold | Swing | ||||
Pensby and Thingwall
| Party | Candidate | Votes | % | ± | |
|---|---|---|---|---|---|
| Labour | Michael Sullivan | 1,406 | 32.8 | ||
| Conservative | Tom Anderson [n 1] | 1,217 | 28.4 | ||
| Liberal Democrats | Damien Cummins | 1,079 | 25.2 | ||
| UKIP | Janet Davison | 394 | 9.2 | ||
| Green | Allen Burton | 190 | 4.4 | ||
| Majority | 189 | 4.4 | N/A | ||
| Registered electors | 10,462 | ||||
| Turnout | 41.1 | ||||
| Labour gain from Liberal Democrats | Swing | ||||
Prenton
| Party | Candidate | Votes | % | ± | |
|---|---|---|---|---|---|
| Labour | Tony Norbury | 2,061 | 53.9 | ||
| Liberal Democrats | Frank Doyle | 895 | 23.4 | ||
| Conservative | Cyrus Ferguson | 357 | 9.3 | ||
| UKIP | James Bradshaw | 313 | 8.2 | ||
| Green | Mark Mitchell | 200 | 5.2 | ||
| Majority | 1,166 | 30.5 | |||
| Registered electors | 10,595 | ||||
| Turnout | 36.2 | ||||
| Labour gain from Liberal Democrats | Swing | ||||
Rock Ferry
| Party | Candidate | Votes | % | ± | |
|---|---|---|---|---|---|
| Labour | Bill Davies | 1,941 | 70.7 | ||
| Conservative | Barbara Poole | 202 | 7.4 | ||
| UKIP | Ann Flynn | 195 | 7.1 | ||
| TUSC | Morag Reid | 130 | 4.7 | New | |
| Green | Joy Hogg | 115 | 4.2 | ||
| Liberal Democrats | Brian Hall | 85 | 3.1 | ||
| Independent | Jim Pritchard | 76 | 2.8 | New | |
| Majority | 1,739 | 63.3 | |||
| Registered electors | 9,564 | ||||
| Turnout | 28.7 | ||||
| Labour hold | Swing | ||||
Seacombe
| Party | Candidate | Votes | % | ± | |
|---|---|---|---|---|---|
| Labour | John Salter | 1,996 | 74.8 | ||
| UKIP | Christopher Wellstead | 278 | 10.4 | ||
| Conservative | Ann Lavin | 258 | 9.7 | ||
| Green | Timothy Denton | 135 | 5.1 | ||
| Majority | 1,718 | 64.4 | |||
| Registered electors | 10,338 | ||||
| Turnout | 25.9 | ||||
| Labour hold | Swing | ||||
Upton
| Party | Candidate | Votes | % | ± | |
|---|---|---|---|---|---|
| Labour | Sylvia Hodrien | 2,504 | 59.6 | ||
| Conservative | Denis Knowles | 948 | 22.6 | ||
| UKIP | Patricia Lamb | 381 | 9.1 | ||
| Green | Lesley Hussenbux | 205 | 4.9 | ||
| Liberal Democrats | Alan Davies | 164 | 3.9 | ||
| Majority | 1,556 | 37.0 | |||
| Registered electors | 12,171 | ||||
| Turnout | 34.6 | ||||
| Labour gain from Conservative | Swing | ||||
Wallasey
| Party | Candidate | Votes | % | ± | |
|---|---|---|---|---|---|
| Conservative | Leah Fraser | 2,652 | 56.1 | ||
| Labour | Alan Hannaford | 1,590 | 33.6 | ||
| UKIP | Ian Watson | 276 | 5.8 | ||
| Green | Janet Wright | 208 | 4.4 | ||
| Majority | 1,062 | 22.5 | |||
| Registered electors | 11,863 | ||||
| Turnout | 40.0 | ||||
| Conservative hold | Swing | ||||
West Kirby and Thurstaston
| Party | Candidate | Votes | % | ± | |
|---|---|---|---|---|---|
| Conservative | Geoffrey Watt | 2,180 | 51.9 | ||
| Labour | Louise Reecejones | 1,082 | 25.8 | ||
| Green | Shirley Johnson | 270 | 6.4 | ||
| Liberal Democrats | John Cresswell | 231 | 5.5 | ||
| UKIP | Frank Whitham | 230 | 5.5 | ||
| Independent | Charles Barnes | 206 | 4.9 | ||
| Majority | 1,098 | 26.1 | |||
| Registered electors | 10,276 | ||||
| Turnout | 40.9 | ||||
| Conservative hold | Swing | ||||
Changes between 2012 and 2014
Leasowe and Moreton East by-election 2013
| Party | Candidate | Votes | % | ± | |
|---|---|---|---|---|---|
| Conservative | Ian Lewis | 1,620 | 50.5 | ||
| Labour | Pauline Daniels | 1,355 | 42.2 | ||
| UKIP | Susan Whitham | 148 | 4.6 | ||
| TUSC | Mark Halligan | 31 | 1.0 | New | |
| Liberal Democrats | Daniel Clein | 28 | 0.9 | New | |
| Green | Jim McGinley | 28 | 0.9 | ||
| Majority | 265 | 8.3 | N/A | ||
| Registered electors | 10,551 | ||||
| Turnout | 30.5 | ||||
| Conservative gain from Labour | Swing | ||||
Heswall by-election 2013
| Party | Candidate | Votes | % | ± | |
|---|---|---|---|---|---|
| Conservative | Kathryn Hodson | 1,254 | 58.8 | ||
| UKIP | David Scott | 460 | 21.6 | ||
| Labour | Mike Holliday | 289 | 13.6 | -4.2 | |
| Green | Barbara Burton | 110 | 5.2 | ||
| TUSC | Greg North | 19 | 0.9 | New | |
| Majority | 794 | 37.2 | |||
| Registered electors | 10,855 | ||||
| Turnout | 19.7 | ||||
| Conservative hold | Swing | ||||
Pensby and Thingwall by-election 2013
| Party | Candidate | Votes | % | ± | |
|---|---|---|---|---|---|
| Labour | Phillip Brightmore | 1,411 | 38.5 | ||
| Conservative | Sheila Clarke | 868 | 23.7 | ||
| Liberal Democrats | Damien Cummins | 834 | 22.7 | ||
| UKIP | Jan Davison | 426 | 11.6 | ||
| Green | Allen Burton | 74 | 2.0 | ||
| English Democrat | Neil Kenny | 53 | 1.4 | New | |
| Majority | 543 | 14.8 | |||
| Registered electors | 10,487 | ||||
| Turnout | 35.0 | ||||
| Labour gain from Conservative | Swing | ||||
Upton by-election 2013
| Party | Candidate | Votes | % | ± | |
|---|---|---|---|---|---|
| Labour | Matthew Patrick | 1,954 | 65.4 | ||
| Conservative | Geoffrey Gubb | 762 | 25.5 | ||
| Green | Jim McGinley | 143 | 4.8 | ||
| Liberal Democrats | Alan Davies | 130 | 4.3 | ||
| Majority | 1,192 | 39.9 | |||
| Registered electors | 12,154 | ||||
| Turnout | 3,031 | 24.9 | |||
| Rejected ballots | 21 | 0.7 | |||
| Labour hold | Swing | ||||
Other changes
| Date | Ward | Name | Previous affiliation | New affiliation | Circumstance | ||
|---|---|---|---|---|---|---|---|
| 30 April 2013 | Pensby and Thingwall | Mark Johnston | Liberal Democrats | Independent | Resigned.[63] | ||
Notes
- Incumbent councillor for Upton ward.
• italics denote the sitting councillor • bold denotes the winning candidate
References
- "Election Result for 3 May 2012 Summary". Wirral Metropolitan Borough Council.
- "Wirral Council under Labour control as party win majority". Liverpool Echo.
- "Election Result for Bebington ward on 3 May 2012". Wirral Metropolitan Borough Council.
- "Councillor Christina Muspratt". Wirral Metropolitan Borough Council.
- "Councillor Sheila Clarke MBE". Wirral Metropolitan Borough Council.
- "Election Result for Bidston and St James ward on 3 May 2012". Wirral Metropolitan Borough Council.
- "Councillor Jim Crabtree". Wirral Metropolitan Borough Council.
- "Election Result for Birkenhead and Tranmere ward on 3 May 2012". Wirral Metropolitan Borough Council.
- "Councillor Pat Cleary". Wirral Metropolitan Borough Council.
- "Councillor Allan Brame". Wirral Metropolitan Borough Council.
- "Election Result for Bromborough ward on 3 May 2012". Wirral Metropolitan Borough Council.
- "Councillor Steve Niblock". Wirral Metropolitan Borough Council.
- "Councillor Kathy Hodson". Wirral Metropolitan Borough Council.
- "Election Result for Clatterbridge ward on 3 May 2012". Wirral Metropolitan Borough Council.
- "Councillor Cherry Povall, JP". Wirral Metropolitan Borough Council.
- "Councillor Phillip Brightmore". Wirral Metropolitan Borough Council.
- "Election Result for Claughton ward on 3 May 2012". Wirral Metropolitan Borough Council.
- "Councillor George Davies". Wirral Metropolitan Borough Council.
- "Election Result for Eastham ward on 3 May 2012". Wirral Metropolitan Borough Council.
- "Councillor Phil Gilchrist". Wirral Metropolitan Borough Council.
- "Election Result for Greasby, Frankby and Irby ward on 3 May 2012". Wirral Metropolitan Borough Council.
- "Councillor Tony Cox". Wirral Metropolitan Borough Council.
- "Councillor Peter Reisdorf". Wirral Metropolitan Borough Council.
- "Election Result for Heswall ward on 3 May 2012". Wirral Metropolitan Borough Council.
- "Councillor Peter Johnson". Wirral Metropolitan Borough Council.
- "Election Result for Hoylake and Meols ward on 3 May 2012". Wirral Metropolitan Borough Council.
- "Councillor John Hale". Wirral Metropolitan Borough Council.
- "Election Result for Leasowe and Moreton East ward on 3 May 2012". Wirral Metropolitan Borough Council.
- "Councillor Anita Leech". Wirral Metropolitan Borough Council.
- "Councillor Ian Lewis". Wirral Metropolitan Borough Council.
- "Election Result for Liscard ward on 3 May 2012". Wirral Metropolitan Borough Council.
- "Councillor Janette Williamson". Wirral Metropolitan Borough Council.
- "Councillor James Keeley". Wirral Metropolitan Borough Council.
- "Election Result for Moreton West and Saughall Massie ward on 3 May 2012". Wirral Metropolitan Borough Council.
- "Councillor Chris Blakeley". Wirral Metropolitan Borough Council.
- "Election Result for New Brighton ward on 3 May 2012". Wirral Metropolitan Borough Council.
- "Councillor Robert Gregson". Wirral Metropolitan Borough Council.
- "Councillor Sue Taylor". Wirral Metropolitan Borough Council.
- "Election Result for Oxton ward on 3 May 2012". Wirral Metropolitan Borough Council.
- "Councillor Pat Williams". Wirral Metropolitan Borough Council.
- "Councillor Matthew Patrick". Wirral Metropolitan Borough Council.
- "Election Result for Pensby and Thingwall ward on 3 May 2012". Wirral Metropolitan Borough Council.
- "Councillor Michael Sullivan". Wirral Metropolitan Borough Council.
- "Councillor Tom Anderson". Wirral Metropolitan Borough Council.
- "Election Result for Prenton ward on 3 May 2012". Wirral Metropolitan Borough Council.
- "Councillor Tony Norbury". Wirral Metropolitan Borough Council.
- "Election Result for Rock Ferry ward on 3 May 2012". Wirral Metropolitan Borough Council.
- "Councillor Bill Davies". Wirral Metropolitan Borough Council.
- "Election Result for Seacombe ward on3 May 2012". Wirral Metropolitan Borough Council.
- "Councillor John Salter". Wirral Metropolitan Borough Council.
- "Election Result for Upton ward on 3 May 2012". Wirral Metropolitan Borough Council.
- "Councillor Sylvia Hodrien". Wirral Metropolitan Borough Council.
- "Councillor Denis Knowles". Wirral Metropolitan Borough Council.
- "Election Result for Wallasey ward on 3 May 2012". Wirral Metropolitan Borough Council.
- "Councillor Leah Fraser". Wirral Metropolitan Borough Council.
- "Election Result for West Kirby and Thurstaston ward on 3 May 2012". Wirral Metropolitan Borough Council.
- "Councillor Geoffrey Watt". Wirral Metropolitan Borough Council.
- "Councillor Louise Reecejones". Wirral Metropolitan Borough Council.
- "Election Result for Leasowe and Moreton East ward on 17 January 2013". Wirral Metropolitan Borough Council. January 2013. Retrieved 1 March 2013.
- "Election Result for Heswall ward on 17 January 2013". Wirral Metropolitan Borough Council. January 2013. Retrieved 1 March 2013.
- "Election Result for Pensby and Thingwall ward on 28 February 2013". Wirral Metropolitan Borough Council. 1 March 2013. Retrieved 1 March 2013.
- "Election Result for Upton ward on 24 October 2013". Wirral Metropolitan Borough Council.
- Murphy, Liam (30 April 2013). "Wirral councillor Mark Johnson quits Liberal Democrat Party". Liverpool Echo. Retrieved 28 December 2018.