1994 Stevenage Borough Council election
The 1994 Stevenage Borough Council election took place on 5 May 1994. This was on the same day as other local elections. One third of the council was up for election; the seats which were last contested in 1990. There was also a second seat up for election in Mobbsbury. The Labour Party retained control of the council, which it had held continuously since its creation in 1973.
| |||||||||||||||||||||||||||||||||||||||||||||||||||||
14 of the 39 seats to Stevenage Borough Council 20 seats needed for a majority | |||||||||||||||||||||||||||||||||||||||||||||||||||||
|---|---|---|---|---|---|---|---|---|---|---|---|---|---|---|---|---|---|---|---|---|---|---|---|---|---|---|---|---|---|---|---|---|---|---|---|---|---|---|---|---|---|---|---|---|---|---|---|---|---|---|---|---|---|
| |||||||||||||||||||||||||||||||||||||||||||||||||||||
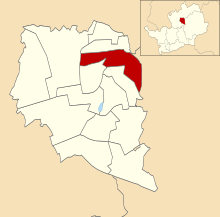
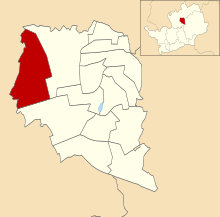
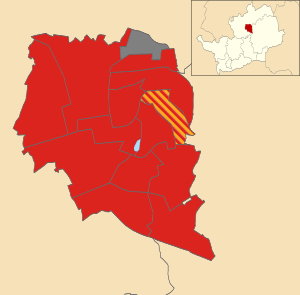 Map showing the results of contested wards in the 1994 Stevenage Borough Council elections. | |||||||||||||||||||||||||||||||||||||||||||||||||||||
| |||||||||||||||||||||||||||||||||||||||||||||||||||||
Overall results
| Party | Seats | Gains | Losses | Net gain/loss | Seats % | Votes % | Votes | +/− | ||
|---|---|---|---|---|---|---|---|---|---|---|
| Labour | 13 | 0 | 92.9 | 59.7 | 13,749 | |||||
| Conservative | 0 | 0 | 0 | 0.0 | 20.6 | 4,744 | ||||
| Liberal Democrats | 1 | 0 | 0 | 7.1 | 18.1 | 4,169 | ||||
| Militant Labour | 0 | 0 | 0 | 0.0 | 0.8 | 179 | ||||
| Green | 0 | 0 | 0 | 0.0 | 0.7 | 172 | ||||
| Total | 13 | 23,013 | ||||||||
| Labour hold | ||||||||||
All comparisons in seats and vote share are to the corresponding 1990 election.
Ward results
Bandley Hill
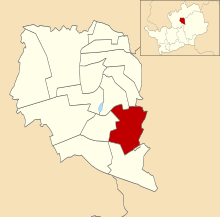
Location of Bandley Hill ward
| Party | Candidate | Votes | % | |
|---|---|---|---|---|
| Labour | Peter L. Wardle[4] | 1,353 | 61.2% | |
| Liberal Democrats | G. Walsh | 364 | 16.5% | |
| Conservative | F. Warner | 315 | 14.2% | |
| Militant Labour | J. Horton | 179 | 8.1% | |
| Turnout | 36.9% | |||
| Labour hold | ||||
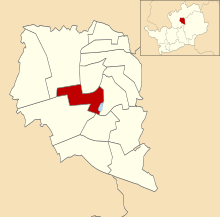
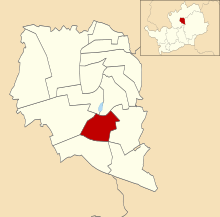
Bedwell Plash

Location of Bedwell Plash ward
| Party | Candidate | Votes | % | |
|---|---|---|---|---|
| Labour | Bill Lawrence[4] | 1,409 | 83.6% | |
| Conservative | M. Wyatt | 277 | 16.4% | |
| Turnout | 43.8% | |||
| Labour hold | ||||
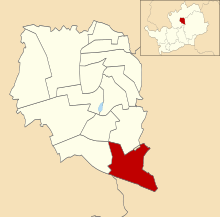
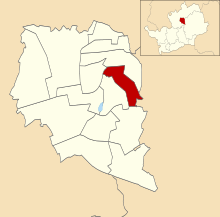
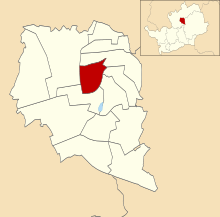
Chells
Location of Chells ward
| Party | Candidate | Votes | % | |
|---|---|---|---|---|
| Labour | Pamela Stuart[4] | 872 | 74.1% | |
| Liberal Democrats | A. Tron | 174 | 14.8% | |
| Conservative | R. Luck | 130 | 11.1% | |
| Turnout | 36.5% | |||
| Labour hold | ||||
Longmeadow
Location of Longmeadow ward
| Party | Candidate | Votes | % | |
|---|---|---|---|---|
| Labour | Ann Webb[4] | 1,258 | 53.2% | |
| Conservative | M. Davies | 573 | 24.2% | |
| Liberal Democrats | G. Robbins | 532 | 22.5% | |
| Turnout | 47.5% | |||
| Labour hold | ||||
Martins Wood
Location of Martins Wood ward
| Party | Candidate | Votes | % | |
|---|---|---|---|---|
| Labour | Gary Marshall[4] | 1,186 | 48.0% | |
| Conservative | E. Fulton | 850 | 34.4% | |
| Liberal Democrats | B. Segadelli | 434 | 17.6% | |
| Turnout | 39.8% | |||
| Labour hold | ||||
Mobbsbury (2 seats)
Location of Mobbsbury ward
| Party | Candidate | Votes | % | |
|---|---|---|---|---|
| Labour | G. O'Carroll | 736 | ||
| Liberal Democrats | A. Berkeley | 734 | ||
| Liberal Democrats | M. Latham | 732 | ||
| Labour | M. Pelling | 702 | ||
| Conservative | G. Hegan | 159 | ||
| Conservative | M. Shaw | 133 | ||
| Turnout | 55.2% | |||
| Labour hold | ||||
| Labour gain from Liberal Democrats | ||||
Monkswood
Location of Monkswood ward
| Party | Candidate | Votes | % | |
|---|---|---|---|---|
| Labour | David Cullen[4] | 745 | 76.2% | |
| Liberal Democrats | M. Harris | 131 | 13.4% | |
| Conservative | P. Gonzalez | 102 | 10.4% | |
| Turnout | 41.7% | |||
| Labour hold | ||||
Old Stevenage
Location of Old Stevenage ward
| Party | Candidate | Votes | % | |
|---|---|---|---|---|
| Labour | Hugh Tessier[4] | 1,250 | 51.4% | |
| Conservative | C. Aylin | 836 | 34.4% | |
| Liberal Democrats | J. Moorcroft | 345 | 14.2% | |
| Turnout | 44.0% | |||
| Labour hold | ||||
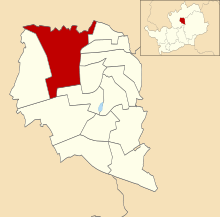
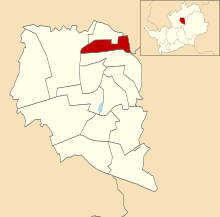
Pin Green
Location of Pin Green ward
| Party | Candidate | Votes | % | |
|---|---|---|---|---|
| Labour | Rej J. Smith[4] | 934 | 61.0% | |
| Conservative | E. Hegan | 299 | 19.5% | |
| Liberal Democrats | S. Grubert | 297 | 19.4% | |
| Turnout | 40.5% | |||
| Labour hold | ||||
Roebuck
Location of Roebuck ward
| Party | Candidate | Votes | % | |
|---|---|---|---|---|
| Labour | Brian Dunnell[4] | 964 | 57.6% | |
| Conservative | A. Harvey | 354 | 21.2% | |
| Liberal Democrats | J. Samochwal | 240 | 14.3% | |
| Green | W. Hoyes | 115 | 6.9% | |
| Turnout | 41.5% | |||
| Labour hold | ||||
St Nicholas
Location of St Nicholas ward
| Party | Candidate | Votes | % | |
|---|---|---|---|---|
| Labour | Stan R. Munden[4] | 634 | 44.3% | |
| Liberal Democrats | M. Griffith | 589 | 41.2% | |
| Conservative | S. Woods | 207 | 14.5% | |
| Turnout | 39.2% | |||
| Labour hold | ||||
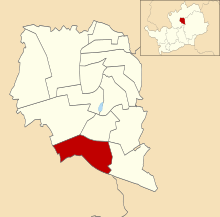
Shephall
Location of Shephall ward
| Party | Candidate | Votes | % | |
|---|---|---|---|---|
| Labour | Eddie Webb | 979 | 85.6% | |
| Conservative | A. Luck | 165 | 14.4% | |
| Turnout | 35.2% | |||
| Labour hold | ||||
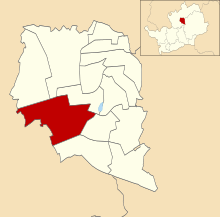
Symonds Green
Location of Symonds Green ward
| Party | Candidate | Votes | % | |
|---|---|---|---|---|
| Labour | David Kissane | 1,429 | 62.3% | |
| Conservative | J. Jode | 477 | 20.8% | |
| Liberal Democrats | K. Taylor | 329 | 14.4% | |
| Green | T. Figg | 57 | 2.5% | |
| Turnout | 42.7% | |||
| Labour hold | ||||
gollark: They MAY be in one of the many places without tornadoes.
gollark: Exactly. They're obviously trying to allay our suspicions so they can do federal agent things more easily.
gollark: Sounds like something a federal agent would say.
gollark: If this is purely an investigational thing then sure, sounds fun. You may also want to investigate right-wing blogs, which I assume exist.
gollark: It's mostly the propaganda bit which would generate annoyance, if they plan to actually deploy that.
References
- "Council compositions by year". The Elections Centre.
- "Local Election Summaries 1994". The Elections Centre.
- "Stevenage Borough Council Election Results 1973–2012" (PDF). Retrieved 11 July 2019.
- "Members of the Council". Archived from the original on 8 November 2002. Retrieved 29 July 2019.
| London boroughs |
|
|---|---|
| Metropolitan boroughs |
|
| District councils (England) |
|
| Regional councils (Scotland) | |
| Referendum | |
| |
This article is issued from Wikipedia. The text is licensed under Creative Commons - Attribution - Sharealike. Additional terms may apply for the media files.