2018 Knowsley Metropolitan Borough Council election
The 2018 Knowsley Metropolitan Borough Council Election took place on 3 May 2018 to elect members of Knowsley Metropolitan Borough Council in England.[1] This was on the same day as other local elections.
| |||||||||||||||||||||||||||||||||||||||||||||||||||||||||||||||||||||||||||||||||||
15 of 45 seats (One Third) to Knowsley Metropolitan Borough Council 23 seats needed for a majority | |||||||||||||||||||||||||||||||||||||||||||||||||||||||||||||||||||||||||||||||||||
|---|---|---|---|---|---|---|---|---|---|---|---|---|---|---|---|---|---|---|---|---|---|---|---|---|---|---|---|---|---|---|---|---|---|---|---|---|---|---|---|---|---|---|---|---|---|---|---|---|---|---|---|---|---|---|---|---|---|---|---|---|---|---|---|---|---|---|---|---|---|---|---|---|---|---|---|---|---|---|---|---|---|---|---|
| Turnout | 25.0% ( | ||||||||||||||||||||||||||||||||||||||||||||||||||||||||||||||||||||||||||||||||||
| |||||||||||||||||||||||||||||||||||||||||||||||||||||||||||||||||||||||||||||||||||
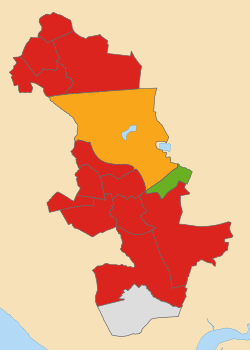
 Map of results of 2018 election | |||||||||||||||||||||||||||||||||||||||||||||||||||||||||||||||||||||||||||||||||||
| |||||||||||||||||||||||||||||||||||||||||||||||||||||||||||||||||||||||||||||||||||
After the election, the composition of the council was:
| Party | Seats | ± | |
|---|---|---|---|
| Labour | 40 | ||
| Liberal Democrats | 3 | ||
| Green | 1 | ||
| Independent | 1 | ||
Election Results
Overall election result
Overall result compared with 2016.
| Knowsley Metropolitan Borough Council Election Results, 2018 | |||||||||||||||
|---|---|---|---|---|---|---|---|---|---|---|---|---|---|---|---|
| Party | Candidates | Votes | |||||||||||||
| Stood | Elected | Gained | Unseated | Net | % of total | % | No. | Net % | |||||||
| Labour | 15 | 12 | 0 | 2 | 80.0 | 66.2 | 19,007 | ||||||||
| Green | 7 | 1 | 1 | 0 | 6.7 | 12.4 | 3,553 | ||||||||
| Independent | 5 | 1 | 1 | 0 | 6.7 | 7.5 | 2,151 | ||||||||
| Liberal Democrats | 4 | 1 | 0 | 0 | 6.7 | 6.8 | 1,958 | ||||||||
| Conservative | 9 | 0 | 0 | 0 | 0.0 | 5.4 | 1,546 | ||||||||
| UKIP | 3 | 0 | 0 | 0 | 0.0 | 1.2 | 334 | ||||||||
| TUSC | 1 | 0 | 0 | 0 | 0.0 | 0.5 | 156 | ||||||||
Changes in council composition
Prior to the election the composition of the council was:
| 42 | 3 |
| Lab | LD |
After the election, the composition of the council was:
| 40 | 3 | 1 | 1 |
| Lab | LD | G | I |
Votes summary
Seats summary
Ward results
Results compared directly with the last local election in 2016.
Cherryfield
| Party | Candidate | Votes | % | ± | |
|---|---|---|---|---|---|
| Labour | David Lonergan | 1,329 | 82.0 | ||
| Green Party - Save Our Green Space | Michael Dooley | 188 | 11.6 | New | |
| Conservative | Adam Butler | 103 | 6.4 | ||
| Majority | 1,141 | 70.4 | |||
| Registered electors | 7,994 | ||||
| Turnout | 1,626 | 20.3 | |||
| Rejected ballots | 6 | 0.4 | |||
| Labour hold | Swing | ||||
Halewood North
| Party | Candidate | Votes | % | ± | |
|---|---|---|---|---|---|
| Labour | Terry Powell | 1,419 | 66.5 | ||
| Independent | Bob Swann | 447 | 20.9 | ||
| Liberal Democrats | Jenny McNeilis | 268 | 12.6 | New | |
| Majority | 972 | 45.6 | |||
| Registered electors | 8,247 | ||||
| Turnout | 2,145 | 26.0 | |||
| Rejected ballots | 11 | 0.5 | |||
| Labour hold | Swing | ||||
Halewood South
| Party | Candidate | Votes | % | ± | |
|---|---|---|---|---|---|
| Independent | Allan Harvey | 1,231 | 47.3 | ||
| Labour | Gary See | 1,190 | 45.8 | ||
| Conservative | Graham Tubey | 180 | 6.9 | ||
| Majority | 41 | 1.5 | N/A | ||
| Registered electors | 8,138 | ||||
| Turnout | 2,610 | 32.1 | |||
| Rejected ballots | 9 | 0.3 | |||
| Independent gain from Labour | Swing | ||||
Northwood
| Party | Candidate | Votes | % | ± | |
|---|---|---|---|---|---|
| Labour | Harry Bell | 1,439 | 86.5 | ||
| Green Party - Save Our Green Space | Russell Greenway | 225 | 13.5 | New | |
| Majority | 1,214 | 73.0 | |||
| Registered electors | 8,399 | ||||
| Turnout | 1,673 | 19.9 | |||
| Rejected ballots | 9 | 0.5 | |||
| Labour hold | Swing | ||||
Page Moss
| Party | Candidate | Votes | % | ± | |
|---|---|---|---|---|---|
| Labour Co-op | Andy Moorhead | 1,152 | 80.1 | ||
| Green Party - Save Our Green Space | Kirk Sandringham | 287 | 19.9 | ||
| Majority | 865 | 60.2 | |||
| Registered electors | 7,737 | ||||
| Turnout | 1,450 | 18.7 | |||
| Rejected ballots | 11 | 0.8 | |||
| Labour Co-op hold | Swing | ||||
Prescot North
| Party | Candidate | Votes | % | ± | |
|---|---|---|---|---|---|
| Liberal Democrats | Frances Wynn | 1,373 | 60.3 | ||
| Labour | Tony Ely | 781 | 34.3 | ||
| Conservative | Aaron Waters | 124 | 5.4 | ||
| Majority | 592 | 26.0 | |||
| Registered electors | 7,580 | ||||
| Turnout | 2,283 | 30.1 | |||
| Rejected ballots | 5 | 0.2 | |||
| Liberal Democrats hold | Swing | ||||
Prescot South
| Party | Candidate | Votes | % | ± | |
|---|---|---|---|---|---|
| Green Party - Save Our Green Space | Kai Taylor | 1,520 | 65.5 | New | |
| Labour | Lynn O’Keeffe | 736 | 31.7 | ||
| Conservative | Sheila Webster | 64 | 2.8 | ||
| Majority | 784 | 33.8 | N/A | ||
| Registered electors | 7,079 | ||||
| Turnout | 2,322 | 32.8 | |||
| Rejected ballots | 2 | 0.1 | |||
| Green gain from Labour | Swing | ||||
Roby
| Party | Candidate | Votes | % | ± | |
|---|---|---|---|---|---|
| Labour | Kevin Bannon | 1,299 | 56.1 | ||
| Green Party - Save Our Green Space | Martin Mackerel | 510 | 22.0 | ||
| Conservative | Antony Reed | 400 | 17.3 | ||
| Independent | Jayne Tattan | 107 | 4.6 | New | |
| Majority | 789 | 34.1 | |||
| Registered electors | 7,460 | ||||
| Turnout | 2,320 | 31.1 | |||
| Rejected ballots | 4 | 0.2 | |||
| Labour hold | Swing | ||||
Shevington
| Party | Candidate | Votes | % | ± | |
|---|---|---|---|---|---|
| Labour | Tommy Rowe | 1,402 | 90.0 | ||
| TUSC | Neill Dunne | 156 | 10.0 | ||
| Majority | 1,246 | 80.0 | |||
| Registered electors | 7,597 | ||||
| Turnout | 1,574 | 20.7 | |||
| Rejected ballots | 16 | 1.0 | |||
| Labour hold | Swing | ||||
St Gabriel's
| Party | Candidate | Votes | % | ± | |
|---|---|---|---|---|---|
| Labour | Dot Johnson | 1,352 | 76.7 | ||
| Liberal Democrats | Dean Boyle | 153 | 8.7 | New | |
| UKIP | Fred Fricker | 131 | 7.4 | ||
| Conservative | Victoria Smart | 127 | 7.2 | ||
| Majority | 1,199 | 68.0 | |||
| Registered electors | 7,239 | ||||
| Turnout | 1,770 | 24.5 | |||
| Rejected ballots | 7 | 0.4 | |||
| Labour hold | Swing | ||||
St Michael's
| Party | Candidate | Votes | % | ± | |
|---|---|---|---|---|---|
| Labour | Kay Moorhead | 1,267 | 84.7 | ||
| Conservative | Sheila Scott | 118 | 7.9 | ||
| UKIP | John Price | 111 | 7.4 | ||
| Majority | 1,149 | 76.8 | |||
| Registered electors | 7,079 | ||||
| Turnout | 1,505 | 21.3 | |||
| Rejected ballots | 9 | 0.6 | |||
| Labour hold | Swing | ||||
Stockbridge
| Party | Candidate | Votes | % | ± | |
|---|---|---|---|---|---|
| Labour | Dennis Baum | 1,189 | 76.7 | ||
| Green Party - Save Our Green Space | Paul Ryan | 189 | 12.2 | New | |
| Independent | Paul Woods | 173 | 11.2 | ||
| Majority | 1,000 | 64.5 | |||
| Registered electors | 7,963 | ||||
| Turnout | 1,556 | 19.5 | |||
| Rejected ballots | 5 | 0.3 | |||
| Labour hold | Swing | ||||
Swanside
| Party | Candidate | Votes | % | ± | |
|---|---|---|---|---|---|
| Labour | Colin Dever | 1,666 | 81.3 | ||
| Independent | Johnny Webster | 193 | 9.4 | New | |
| Conservative | Carole Sullivan | 190 | 9.3 | ||
| Majority | 1,473 | 71.9 | |||
| Registered electors | 7,456 | ||||
| Turnout | 2,057 | 27.6 | |||
| Rejected ballots | 8 | 0.4 | |||
| Labour hold | Swing | ||||
Whiston and Cronton
| Party | Candidate | Votes | % | ± | |
|---|---|---|---|---|---|
| Labour | Gillian Flatley | 1,207 | 55.5 | ||
| Green Party - Save Our Green Space | Ron Gaffney | 634 | 29.2 | New | |
| Conservative | Carl Cross | 240 | 11.0 | ||
| UKIP | Neil Miney | 92 | 4.2 | New | |
| Majority | 573 | 26.3 | |||
| Registered electors | 7,480 | ||||
| Turnout | 2,179 | 29.1 | |||
| Rejected ballots | 6 | 0.3 | |||
| Labour hold | Swing | ||||
Whitefield
| Party | Candidate | Votes | % | ± | |
|---|---|---|---|---|---|
| Labour | Louise Harbour | 1,579 | 90.6 | ||
| Liberal Democrats | Les Rigby | 164 | 9.4 | New | |
| Majority | 1,415 | 81.2 | |||
| Registered electors | 7,924 | ||||
| Turnout | 1,763 | 22.3 | |||
| Rejected ballots | 20 | 1.1 | |||
| Labour hold | Swing | ||||
Changes between 2018 and 2019
Halewood South by-election 2018
| Party | Candidate | Votes | % | ± | |
|---|---|---|---|---|---|
| Labour | Gary See | 1,012 | 51.6 | ||
| Independent | Bob Swann | 778 | 39.7 | ||
| Liberal Democrats | Jenny McNeilis | 118 | 6.0 | New | |
| Conservative | Ruth Smart | 54 | 2.8 | ||
| Majority | 234 | 11.9 | N/A | ||
| Turnout | 1,968 | ||||
| Rejected ballots | 6 | 0.3 | |||
| Labour hold | Swing | ||||
Notes
• italics denote a sitting councillor • bold denotes the winning candidate
gollark: Only the site itself can give people CB prizes.
gollark: The site is the only thing capable of magically summoning new eggs.
gollark: The raffles here are a player thing.
gollark: You click one button.
gollark: I personally think there should be SAlts of all dragons if the spriter wants them.
References
- "Notice of Election" (PDF). Knowsley Metropolitan Borough Council.
- "Borough Elections Results - May 2018" (PDF). Knowsley Metropolitan Borough Council.
- "Halewood South Ward By-election Results" (PDF). Knowsley Metropolitan Borough Council. Retrieved 24 August 2018.
- "Statements of Persons Nominated". Knowsley Metropolitan Borough Council. Retrieved 23 August 2018.
This article is issued from Wikipedia. The text is licensed under Creative Commons - Attribution - Sharealike. Additional terms may apply for the media files.
