1996 Wirral Metropolitan Borough Council election
The 1996 Wirral Metropolitan Borough Council election took place on 2 May 1996 to elect members of Wirral Metropolitan Borough Council in England.[2] This election was held on the same day as other local elections.
| |||||||||||||||||||||||||||||||||||||||||||||||||
22 of 66 seats (One Third) to Wirral Metropolitan Borough Council 34 seats needed for a majority | |||||||||||||||||||||||||||||||||||||||||||||||||
|---|---|---|---|---|---|---|---|---|---|---|---|---|---|---|---|---|---|---|---|---|---|---|---|---|---|---|---|---|---|---|---|---|---|---|---|---|---|---|---|---|---|---|---|---|---|---|---|---|---|
| Turnout | 35.0% ( | ||||||||||||||||||||||||||||||||||||||||||||||||
| |||||||||||||||||||||||||||||||||||||||||||||||||
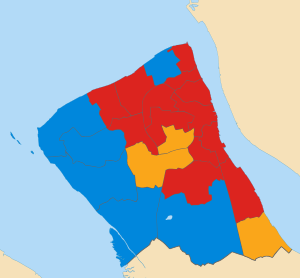 Map of results of 1996 election | |||||||||||||||||||||||||||||||||||||||||||||||||
| |||||||||||||||||||||||||||||||||||||||||||||||||
After the election, the composition of the council was:
| Party | Seats | ± | |
|---|---|---|---|
| Labour | 41 | ||
| Conservative | 16 | ||
| Liberal Democrats | 9 | ||
Election results
Overall election result
Overall result compared with 1995.
| Wirral Metropolitan Borough Council election results, 1996 | |||||||||||||||
|---|---|---|---|---|---|---|---|---|---|---|---|---|---|---|---|
| Party | Candidates | Votes | |||||||||||||
| Stood | Elected | Gained | Unseated | Net | % of total | % | No. | Net % | |||||||
| Labour | 22 | 13 | 5 | 0 | 59.1 | 48.9 | 41,521 | ||||||||
| Conservative | 20 | 6 | 0 | 6 | 27.3 | 30.2 | 25,611 | ||||||||
| Liberal Democrats | 22 | 3 | 1 | 0 | 13.6 | 20.1 | 17,066 | ||||||||
| Green | 6 | 0 | 0 | 0 | 0.0 | 0.7 | 555 | ||||||||
| Independent | 1 | 0 | 0 | 0 | 0.0 | 0.2 | 161 | N/A | |||||||
Ward results
Bebington
| Party | Candidate | Votes | % | ± | |
|---|---|---|---|---|---|
| Labour | Keith Williams | 2,171 | 47.7 | ||
| Conservative | Brian Cummings | 1,940 | 42.6 | ||
| Liberal Democrats | Kevin Turner | 363 | 8.0 | ||
| Green | Ann Jones | 77 | 1.7 | New | |
| Majority | 231 | 5.1 | |||
| Registered electors | 10,555 | ||||
| Turnout | 43.1 | ||||
| Labour gain from Conservative | Swing | ||||
Bidston
| Party | Candidate | Votes | % | ± | |
|---|---|---|---|---|---|
| Labour | J. Williams | 1,713 | 88.4 | ||
| Liberal Democrats | John Tomlinson | 224 | 11.6 | ||
| Majority | 1,489 | 76.9 | |||
| Registered electors | 8,211 | ||||
| Turnout | 23.6 | ||||
| Labour hold | Swing | ||||
Birkenhead
| Party | Candidate | Votes | % | ± | |
|---|---|---|---|---|---|
| Labour | D. Gower | 2,228 | 88.0 | ||
| Liberal Democrats | Michael Redfern | 303 | 12.0 | ||
| Majority | 1,925 | 76.1 | |||
| Registered electors | 10,211 | ||||
| Turnout | 24.8 | ||||
| Labour hold | Swing | ||||
Bromborough
| Party | Candidate | Votes | % | ± | |
|---|---|---|---|---|---|
| Labour | David Jackson | 2,401 | 65.1 | ||
| Conservative | K. Roberts | 658 | 17.9 | ||
| Liberal Democrats | M. Bolton | 384 | 10.4 | ||
| Independent | J. Rohan | 161 | 4.4 | New | |
| Green | J. Jones | 82 | 2.2 | New | |
| Majority | 1,743 | 47.3 | |||
| Registered electors | 10,752 | ||||
| Turnout | 34.3 | ||||
| Labour hold | Swing | ||||
Clatterbridge
| Party | Candidate | Votes | % | ± | |
|---|---|---|---|---|---|
| Conservative | Michael Moore | 2,478 | 45.1 | ||
| Labour | L. Flanagan | 2,066 | 37.6 | ||
| Liberal Democrats | W. Walsh | 947 | 17.2 | ||
| Majority | 412 | 7.5 | N/A | ||
| Registered electors | 13,713 | ||||
| Turnout | 40.0 | ||||
| Conservative hold | Swing | ||||
Claughton
| Party | Candidate | Votes | % | ± | |
|---|---|---|---|---|---|
| Labour | George Davies | 2,007 | 51.7 | ||
| Liberal Democrats | Stuart Kelly | 1,237 | 31.8 | ||
| Conservative | P. Greening-Jackson | 560 | 14.4 | ||
| Green | George Bowler | 80 | 2.1 | ||
| Majority | 770 | 19.8 | |||
| Registered electors | 10,359 | ||||
| Turnout | 37.5 | ||||
| Labour hold | Swing | ||||
Eastham
| Party | Candidate | Votes | % | ± | |
|---|---|---|---|---|---|
| Liberal Democrats | Phillip Gilchrist | 2,805 | 65.1 | ||
| Labour | A. McGuiness | 1,059 | 24.6 | ||
| Conservative | S. Hutchence | 444 | 10.3 | ||
| Majority | 1,746 | 40.5 | |||
| Registered electors | 11,170 | ||||
| Turnout | 38.6 | ||||
| Liberal Democrats hold | Swing | ||||
Egerton
| Party | Candidate | Votes | % | ± | |
|---|---|---|---|---|---|
| Labour | Andew Dow | 2,290 | 75.3 | ||
| Conservative | H. Jackson-Payne | 407 | 13.4 | ||
| Liberal Democrats | Philip Lloyd | 238 | 7.8 | ||
| Green | Joyce Hogg | 107 | 3.5 | ||
| Majority | 1,883 | 61.9 | |||
| Registered electors | 10,554 | ||||
| Turnout | 28.8 | ||||
| Labour hold | Swing | ||||
Heswall
| Party | Candidate | Votes | % | ± | |
|---|---|---|---|---|---|
| Conservative | T. Price | 2,820 | 60.3 | ||
| Liberal Democrats | Edward Norton | 1,040 | 22.2 | ||
| Labour | C. Murphy | 820 | 17.5 | ||
| Majority | 1,780 | 38.0 | |||
| Registered electors | 13,119 | ||||
| Turnout | 35.7 | ||||
| Conservative hold | Swing | ||||
Hoylake
| Party | Candidate | Votes | % | ± | |
|---|---|---|---|---|---|
| Conservative | Hilary Jones | 2,433 | 55.5 | ||
| Labour | Alan Milne | 1,218 | 27.8 | ||
| Liberal Democrats | A. Richards | 733 | 16.7 | ||
| Majority | 1,215 | 27.7 | |||
| Registered electors | 12,232 | ||||
| Turnout | 35.8 | ||||
| Conservative hold | Swing | ||||
Leasowe
| Party | Candidate | Votes | % | ± | |
|---|---|---|---|---|---|
| Labour | Ronald Abbey | 2,169 | 77.1 | ||
| Conservative | Ian Lewis | 418 | 14.8 | ||
| Liberal Democrats | C. Robertson | 228 | 8.1 | ||
| Majority | 1,751 | 62.2 | |||
| Registered electors | 9,345 | ||||
| Turnout | 30.1 | ||||
| Labour hold | Swing | ||||
Liscard
| Party | Candidate | Votes | % | ± | |
|---|---|---|---|---|---|
| Labour | Denis Knowles | 2,421 | 64.6 | ||
| Conservative | M. Ebbs | 883 | 23.6 | New | |
| Liberal Democrats | M. Todd | 444 | 11.8 | ||
| Majority | 1,538 | 41.0 | |||
| Registered electors | 11,087 | ||||
| Turnout | 33.8 | ||||
| Labour gain from Conservative | Swing | ||||
Moreton
| Party | Candidate | Votes | % | ± | |
|---|---|---|---|---|---|
| Labour | Ann McLachlan | 2,148 | 60.5 | ||
| Conservative | Vic Borg | 1,177 | 33.1 | ||
| Liberal Democrats | Susanne Uriel | 228 | 6.4 | ||
| Majority | 971 | 27.3 | |||
| Registered electors | 9,583 | ||||
| Turnout | 37.1 | ||||
| Labour gain from Conservative | Swing | ||||
New Brighton
| Party | Candidate | Votes | % | ± | |
|---|---|---|---|---|---|
| Labour | V. McGee | 2,132 | 59.3 | ||
| Conservative | H. Tooke | 1,038 | 28.9 | ||
| Liberal Democrats | John Codling | 424 | 11.8 | ||
| Majority | 1,094 | 30.4 | |||
| Registered electors | 11,289 | ||||
| Turnout | 31.8 | ||||
| Labour gain from Conservative | Swing | ||||
Oxton
| Party | Candidate | Votes | % | ± | |
|---|---|---|---|---|---|
| Liberal Democrats | Alec Dunn | 2,221 | 56.3 | ||
| Labour | Pauline Cocker | 1,123 | 28.5 | ||
| Conservative | Cyrus Ferguson | 524 | 13.3 | ||
| Green | Garnette Bowler | 75 | 1.9 | ||
| Majority | 1,098 | 27.8 | |||
| Registered electors | 11,261 | ||||
| Turnout | 35.0 | ||||
| Liberal Democrats hold | Swing | ||||
Prenton
| Party | Candidate | Votes | % | ± | |
|---|---|---|---|---|---|
| Liberal Democrats | Margaret Bridson | 2,300 | 47.8 | ||
| Labour | R. Pullen | 1,595 | 33.2 | ||
| Conservative | J. Thomas | 912 | 19.0 | ||
| Majority | 705 | 14.7 | |||
| Registered electors | 11,399 | ||||
| Turnout | 42.2 | ||||
| Liberal Democrats gain from Conservative | Swing | ||||
Royden
| Party | Candidate | Votes | % | ± | |
|---|---|---|---|---|---|
| Conservative | Derek Robinson | 2,280 | 50.1 | ||
| Labour | R. Pennington | 1,307 | 28.7 | ||
| Liberal Democrats | Peter Reisdorf | 966 | 21.2 | ||
| Majority | 973 | 21.4 | |||
| Registered electors | 10,963 | ||||
| Turnout | 41.5 | ||||
| Conservative hold | Swing | ||||
Seacombe
| Party | Candidate | Votes | % | ± | |
|---|---|---|---|---|---|
| Labour | P. Clee | 2,564 | 82.7 | ||
| Liberal Democrats | Moira Gallagher | 297 | 9.6 | ||
| Conservative | Patricia Jones | 240 | 7.7 | ||
| Majority | 2,267 | 73.1 | |||
| Registered electors | 10,963 | ||||
| Turnout | 28.3 | ||||
| Labour hold | Swing | ||||
Thurstaston
| Party | Candidate | Votes | % | ± | |
|---|---|---|---|---|---|
| Conservative | Sid Dunn | 2,454 | 51.1 | ||
| Labour | A. Beer | 1,849 | 38.5 | ||
| Liberal Democrats | Charles Wall | 495 | 10.3 | ||
| Majority | 605 | 12.6 | |||
| Registered electors | 12,228 | ||||
| Turnout | 39.1 | ||||
| Conservative hold | Swing | ||||
Tranmere
| Party | Candidate | Votes | % | ± | |
|---|---|---|---|---|---|
| Labour | Moira McLaughlin | 1,824 | 79.9 | ||
| Conservative | C. Bowditch | 174 | 7.6 | ||
| Liberal Democrats | Stephen Blaylock | 151 | 6.6 | ||
| Green | Catherine Page | 134 | 5.9 | ||
| Majority | 1,650 | 72.3 | |||
| Registered electors | 9,509 | ||||
| Turnout | 24.0 | ||||
| Labour hold | Swing | ||||
Upton
| Party | Candidate | Votes | % | ± | |
|---|---|---|---|---|---|
| Labour | A. Bell | 2,579 | 58.3 | ||
| Conservative | L. Turnbull | 1,350 | 30.5 | ||
| Liberal Democrats | N. Sherwen | 492 | 11.1 | ||
| Majority | 1,229 | 27.8 | |||
| Registered electors | 12,466 | ||||
| Turnout | 35.5 | ||||
| Labour gain from Conservative | Swing | ||||
Wallasey
| Party | Candidate | Votes | % | ± | |
|---|---|---|---|---|---|
| Conservative | Kate Wood | 2,421 | 50.4 | ||
| Labour | Geoffrey Caton | 1,837 | 38.2 | ||
| Liberal Democrats | John Uriel | 546 | 11.4 | ||
| Majority | 584 | 12.2 | N/A | ||
| Registered electors | 11,690 | ||||
| Turnout | 41.1 | ||||
| Conservative hold | Swing | ||||
Changes between 1996 and 1998
Wallasey by-election 1997
| Party | Candidate | Votes | % | ± | |
|---|---|---|---|---|---|
| Conservative | Lesley Rennie | 1,781 | 47.3 | ||
| Labour | Elizabeth McArdle | 1,490 | 39.5 | ||
| Liberal Democrats | John Uriel | 443 | 11.8 | ||
| Green | George Bowler | 54 | 1.4 | New | |
| Majority | 291 | 7.7 | |||
| Turnout | 32.2 | ||||
| Conservative hold | Swing | ||||
Other changes
| Date | Ward | Name | Previous affiliation | New affiliation | Circumstance | ||
|---|---|---|---|---|---|---|---|
| ? | Prenton | Ed Cunniffe | Liberal Democrats | Ind. Liberal Democrat | Resigned.[19] | ||
Notes
• italics denote the sitting councillor • bold denotes the winning candidate
gollark: I at least want hardware I can actually replace/upgrade parts in.
gollark: Also software designed that way.
gollark: This might be a mindset thing. I like "hackable" devices I can actually control.
gollark: Unrepairable devices are horrendously wasteful.
gollark: > i like my phone being one unrepairable pieceWhy would you WANT that?
References
- "Local Election Summaries 1996". The Elections Centre. Retrieved 17 January 2019.
- "Metropolitan Borough of Wirral Election Results 1973-2012 (Pg. 13 and 14)" (PDF). The Elections Centre. Retrieved 17 January 2019.
- "Council compositions". The Elections Centre. Retrieved 27 July 2018.
- "Councillor Jerry Williams". Wirral Metropolitan Borough Council.
- "Councillor George Davies". Wirral Metropolitan Borough Council.
- "Councillor Stuart Kelly". Wirral Metropolitan Borough Council.
- "Councillor Phil Gilchrist". Wirral Metropolitan Borough Council.
- "Councillor Ron Abbey". Wirral Metropolitan Borough Council.
- "Councillor Ian Lewis". Wirral Metropolitan Borough Council.
- "Councillor Denis Knowles". Wirral Metropolitan Borough Council.
- "Councillor Ann McLachlan". Wirral Metropolitan Borough Council.
- "Councillor Ann Bridson". Wirral Metropolitan Borough Council.
- "Councillor Peter Reisdorf". Wirral Metropolitan Borough Council.
- "Councillor Moira McLaughlin". Wirral Metropolitan Borough Council.
- "Councillor Mrs Kate Wood". Wirral Metropolitan Borough Council.
- "Kate calls Labour foul on soccer". Wirral Globe. 26 March 1997. Retrieved 27 November 2009.
- "Councillor Lesley Rennie". Wirral Metropolitan Borough Council.
- "Councillor Anne McArdle". Wirral Metropolitan Borough Council.
- "Lib Dem councillor switches sides". Wirral Globe. Retrieved 26 December 2018.
Mellows-Facer, Adam (10 May 2006). "Local election 2006". parliament.uk. Retrieved 29 December 2018.
"BBC NEWS VOTE 2003 WIRRAL". BBC News. 1 May 2003. Retrieved 29 December 2018.
| Metropolitan boroughs |
|
|---|---|
| Unitary authorities |
|
| District councils |
|
| Ad-hoc election | |
This article is issued from Wikipedia. The text is licensed under Creative Commons - Attribution - Sharealike. Additional terms may apply for the media files.