1994 Tayside Regional Council election
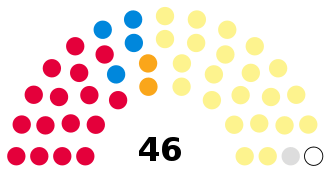
The sixth and last election to Tayside Regional Council was held on 5 May 1994 as part of the wider 1994 Scottish regional elections & British local elections. The election saw the SNP overtaking Labour to become the council's largest party, and following the election the SNP formed a minority administration under Councillor Lena Graham.
After 8 weeks however Graham resigned 'for personal reasons' and Ewan Dow took over as council leader. Dow was 22 years old at the time, making him the youngest ever Scottish council leader since records began.[1]
Voter turnout was 45.5%.
The result of the election
Aggregate results
| Party | Seats | Gains | Losses | Net gain/loss | Seats % | Votes % | Votes | +/− | |
|---|---|---|---|---|---|---|---|---|---|
| SNP | 22 | 39.6 | 54,640 | ||||||
| Labour | 16 | 25.7 | 35,561 | ||||||
| Conservative | 4 | 20.9 | 28,869 | ||||||
| Liberal Democrats | 2 | 9.4 | 13,026 | ||||||
| Independent | 1 | 1.7 | 2,386 | ||||||
| Other parties | 1 | 1.8 | 2,539 | ||||||
| Green | 0 | 0.7 | 907 | ||||||
Ward results
Each of the 46 electoral divisions elected one representative under the first past the post voting system.
Angus
| Party | Candidate | Votes | % | |
|---|---|---|---|---|
| SNP | A. King | 1,440 | 48.7 | |
| Liberal Democrats | R. B. Spears | 1,218 | 41.2 | |
| Conservative | R. Irvine | 296 | 48.7 | |
| Majority | 222 | |||
| Turnout | 45.5 | |||
| Party | Candidate | Votes | % | |
|---|---|---|---|---|
| SNP | G. A. Lamont | 1,103 | 31.2 | |
| Liberal Democrats | G. Ryalls | 937 | 26.5 | |
| Conservative | J. A. McAdam | 835 | 23.6 | |
| Labour | P. A. Wardlaw | 325 | 9.2 | |
| Majority | 166 | |||
| Turnout | 52.3 | |||
| Party | Candidate | Votes | % | |
|---|---|---|---|---|
| SNP | H. M. W. Angus | 1,423 | 50.2 | |
| Conservative | E. C. Hill | 700 | 24.7 | |
| Labour | J. Warren | 346 | 12.2 | |
| Liberal Democrats | H. O'F. Will | 289 | 10.2 | |
| Scottish Green | P. C. Roberts | 74 | 2.6 | |
| Majority | 723 | |||
| Turnout | 43.5% | |||
| Party | Candidate | Votes | % | |
|---|---|---|---|---|
| SNP | A. W. Shand | 1,791 | 48.8 | |
| Labour | F. G. Pearson | 792 | 21.6 | |
| Conservative | R. D. Ramsay | 292 | 7.9 | |
| Majority | 999 | |||
| Turnout | 51.9 | |||
| Party | Candidate | Votes | % | |
|---|---|---|---|---|
| SNP | R. Lamont | 1,329 | 41.1 | |
| Conservative | J. Gray | 759 | 25.1 | |
| Labour | P. A. Murphy | 727 | 24.1 | |
| Liberal Democrats | G. McBeth | 198 | 6.5 | |
| Majority | 570 | |||
| Turnout | 45.9 | |||
| Party | Candidate | Votes | % | |
|---|---|---|---|---|
| SNP | F. E. Duncan | 2,067 | 67.5 | |
| Conservative | B. J. T. Townsend | 642 | 21.1 | |
| Labour | L. Hood | 345 | 11.2 | |
| Majority | 1421 | |||
| Turnout | 43.7 | |||
| Party | Candidate | Votes | % | |
|---|---|---|---|---|
| SNP | I. S. Hudghton | 1,883 | 63.1 | |
| Conservative | A. A. A. Cochrane-Dyet | 523 | 17.5 | |
| Liberal Democrats | H. C. Fleming | 289 | 9.6 | |
| Labour | G. MacDonald | 289 | 9.6 | |
| Majority | 1,360 | |||
| Turnout | 42.0 | |||
| Party | Candidate | Votes | % | |
|---|---|---|---|---|
| SNP | W. A. West | 1,435 | 59.1 | |
| Conservative | D. J. Stubbs | 579 | 23.8 | |
| Labour | S. Singh | 248 | 10.2 | |
| Liberal Democrats | A. W. Warren | 165 | 3.8 | |
| Majority | 856 | |||
| Turnout | 38.7 | |||
| Party | Candidate | Votes | % | |
|---|---|---|---|---|
| SNP | D. C. Doward | 1,460 | 49.8 | |
| Conservative | W. Johnston | 897 | 30.6 | |
| Labour | J. Stewart | 571 | 19.5 | |
| Majority | 563 | |||
| Turnout | 43.3 | |||
| Party | Candidate | Votes | % | |
|---|---|---|---|---|
| Conservative | H. S. Arbuthnott | 1,415 | 44.9 | |
| SNP | R. Berrie | 1,347 | 42.8 | |
| Labour | D. K. Todd | 384 | 12.2 | |
| Majority | 68 | |||
| Turnout | 44.7 | |||
| Party | Candidate | Votes | % | |
|---|---|---|---|---|
| SNP | G. P. Allan | 2,061 | 56.6 | |
| Conservative | R. J. L. Melville | 971 | 26.6 | |
| Labour | I. A. McFatridge | 431 | 11.8 | |
| Liberal Democrats | M. I. Gillespie | 175 | 4.8 | |
| Majority | 1090 | |||
| Turnout | 49.9 | |||
City of Dundee
| Party | Candidate | Votes | % | |
|---|---|---|---|---|
| Labour | J. D. Kemp | 1,031 | 47.8 | |
| SNP | D. C. L. Blake | 478 | 23.6 | |
| Liberal Democrats | D. A. Stansfield | 316 | 14.9 | |
| Conservative | J. C. W. Justice | 189 | 8.9 | |
| Scottish Green | F. Conacher | 99 | 4.6 | |
| Majority | 553 | |||
| Turnout | 30.1 | |||
| Party | Candidate | Votes | % | |
|---|---|---|---|---|
| Conservative | N. I. C. Powrie | 1,429 | 42.1 | |
| Labour | S. R. Butcher | 1,206 | 35.6 | |
| SNP | C. Cashley | 423 | 12.4 | |
| Liberal Democrats | D. R. MacDonald | 260 | 7.6 | |
| Scottish Green | E. C. Hood | 72 | 2.0 | |
| Majority | 223 | |||
| Turnout | 50.2 | |||
| Party | Candidate | Votes | % | |
|---|---|---|---|---|
| Labour | G. W. Buckman | 1,767 | 60.6 | |
| SNP | N. Maiden | 622 | 21.3 | |
| Conservative | A. G. L. Powrie | 297 | 10.1 | |
| Liberal Democrats | R. J. Coates | 141 | 4.8 | |
| Scottish Green | C. J. S. Cassells | 87 | 2.9 | |
| Majority | 1,145 | |||
| Turnout | 44.9 | |||
| Party | Candidate | Votes | % | |
|---|---|---|---|---|
| Labour | B. Paterson | 1,637 | 54.7 | |
| SNP | P. L. Mulheron | 755 | 25.2 | |
| Conservative | W. C. Blackwood | 365 | 12.2 | |
| Liberal Democrats | S. M. Tennant | 153 | 5.1 | |
| Scottish Green | S. M. Hendry | 82 | 2.7 | |
| Majority | 882 | |||
| Turnout | 44.4 | |||
| Party | Candidate | Votes | % | |
|---|---|---|---|---|
| Labour | J. C. McGovern | 1,546 | 60.4 | |
| SNP | E. Black | 650 | 25.4 | |
| Conservative | D. E. Hay | 176 | 6.8 | |
| Scottish Militant Labour | P. H. Manley | 154 | 6.0 | |
| Communist | T. D. Burn | 30 | 1.1 | |
| Majority | 869 | |||
| Turnout | 35.2 | |||
| Party | Candidate | Votes | % | |
|---|---|---|---|---|
| Labour | D. Macmillan | 1,413 | 39.1 | |
| SNP | J. Corrigan | 1,082 | 30.0 | |
| Conservative | P. D. Scott | 935 | 25.9 | |
| Liberal Democrats | E. A. Dwyer | 177 | 4.9 | |
| Majority | 331 | |||
| Turnout | 53.9 | |||
| Party | Candidate | Votes | % | |
|---|---|---|---|---|
| Labour | W. Derby | 1,693 | 58.2 | |
| SNP | M. T. B. Anderson | 700 | 24.0 | |
| Conservative | J. N. Gowans | 294 | 10.1 | |
| Liberal Democrats | G. Cowie | 222 | 7.6 | |
| Majority | 993 | |||
| Turnout | 46.7 | |||
| Party | Candidate | Votes | % | |
|---|---|---|---|---|
| Labour | J. R. Letford | 1,834 | 61.8 | |
| SNP | D. Cashley | 994 | 33.5 | |
| Liberal Democrats | C. Newell | 139 | 4.6 | |
| Majority | 840 | |||
| Turnout | 45.4 | |||
| Party | Candidate | Votes | % | |
|---|---|---|---|---|
| Labour | G. C. Hood | 1,113 | 50.3 | |
| SNP | M. Lennie | 497 | 22.5 | |
| Scottish Militant Labour | B. Wallace | 334 | 15.1 | |
| Liberal Democrats | I. K. Ridley | 265 | 12.0 | |
| Majority | 686 | |||
| Turnout | 38.2 | |||
| Party | Candidate | Votes | % | |
|---|---|---|---|---|
| Independent Labour | I. Borthwick | 2,021 | 61.1 | |
| Labour | W. Wright | 831 | 21.3 | |
| SNP | E. S. Scott | 454 | 13.7 | |
| Majority | 1,190 | |||
| Turnout | 50.6 | |||
| Party | Candidate | Votes | % | |
|---|---|---|---|---|
| Labour | W. Barr | 1,529 | 57.9 | |
| SNP | N. Maiden | 1,108 | 42.0 | |
| Majority | 421 | |||
| Turnout | 41.5 | |||
| Party | Candidate | Votes | % | |
|---|---|---|---|---|
| Labour | M. J. Rolfe | 1,886 | 57.6 | |
| SNP | D. McGovern | 732 | 22.3 | |
| Conservative | D. J. Searle | 468 | 14.2 | |
| Liberal Democrats | J. M. Mainland | 188 | 5.7 | |
| Majority | 1,154 | |||
| Turnout | 47.6 | |||
| Party | Candidate | Votes | % | |
|---|---|---|---|---|
| Labour | M. Barr | 1,239 | 50.4 | |
| SNP | A. A. Petrie | 775 | 31.5 | |
| Conservative | S. McQuire | 387 | 15.7 | |
| Scottish Green | D. M. McCabe | 55 | 2.2 | |
| Majority | 464 | |||
| Turnout | 38.7 | |||
| Party | Candidate | Votes | % | |
|---|---|---|---|---|
| Labour | H. Connolly | 2,028 | 69.3 | |
| SNP | K. Young | 808 | 27.6 | |
| Conservative | D. Kinnear | 88 | 3.0 | |
| Majority | 1,220 | |||
| Turnout | 43.9 | |||
| Party | Candidate | Votes | % | |
|---|---|---|---|---|
| SNP | J. C. Duthie | 895 | 46.0 | |
| Labour | G. Barr | 894 | 45.9 | |
| Liberal Democrats | D. T. Dargie | 58 | 2.9 | |
| Conservative | J. D. Mackie | 40 | 2.0 | |
| Majority | 1 | |||
| Turnout | 36.7 | |||
| Party | Candidate | Votes | % | |
|---|---|---|---|---|
| Labour | J. Mudie | 1,950 | 66.3 | |
| SNP | F. Carlin | 842 | 28.6 | |
| Conservative | E. T. Hay | 146 | 4.9 | |
| Majority | 1,108 | |||
| Turnout | 44.5 | |||
| Party | Candidate | Votes | % | |
|---|---|---|---|---|
| Conservative | J. C. Cathro | 1,266 | 35.8 | |
| SNP | K. J. N. Guild | 1,157 | 32.7 | |
| Labour | I. Birnie | 881 | 24.9 | |
| Liberal Democrats | R. B. Johnston | 229 | 6.4 | |
| Majority | 109 | |||
| Turnout | 50.8 | |||
| Party | Candidate | Votes | % | |
|---|---|---|---|---|
| Conservative | B.D. Mackie | 1,265 | 37.9 | |
| SNP | A. J. Lawrence | 942 | 28.8 | |
| Liberal Democrats | A. Best | 611 | 18.3 | |
| Labour | G. Cruickshank | 517 | 15.5 | |
| Majority | 323 | |||
| Turnout | 49.9 | |||
| Party | Candidate | Votes | % | |
|---|---|---|---|---|
| SNP | R. J. Murray | 1,655 | 52.0 | |
| Conservative | D. McNaughton | 1,052 | 33.1 | |
| Labour | A. R. Butler | 470 | 14.7 | |
| Majority | 603 | |||
| Turnout | 46.4 | |||
| Party | Candidate | Votes | % | |
|---|---|---|---|---|
| SNP | F. Ellis | 1,668 | 52.0 | |
| Conservative | A. H. Brown | 1,397 | 37.6 | |
| Labour | G. J. Martin | 458 | 12.3 | |
| Scottish Green | S. E. Baird | 186 | 5.0 | |
| Majority | 271 | |||
| Turnout | 53.1 | |||
Perth and Kinross
| Party | Candidate | Votes | % | |
|---|---|---|---|---|
| Independent | J. Doig | 1,704 | 65.6 | |
| Conservative | J. McNicol | 637 | 24.5 | |
| Scottish Green | P. F. Cheer | 254 | 9.1 | |
| Majority | 1,067 | |||
| Turnout | 38.0 | |||
| Party | Candidate | Votes | % | |
|---|---|---|---|---|
| Labour | M. H. Lennie | 1,327 | 44.4 | |
| SNP | N. M. Sime | 943 | 31.5 | |
| Conservative | L. Hurrell | 442 | 14.7 | |
| Liberal Democrats | G. Syme | 227 | 9.2 | |
| Majority | 384 | |||
| Turnout | 44.1 | |||
| Party | Candidate | Votes | % | |
|---|---|---|---|---|
| Liberal Democrats | L. Caddell | 2,250 | 63.2 | |
| Conservative | I. Spresser | 739 | 20.7 | |
| SNP | E. C. MacLachlan | 566 | 15.9 | |
| Majority | 1,511 | |||
| Turnout | 50.8 | |||
| Party | Candidate | Votes | % | |
|---|---|---|---|---|
| Labour | C. Gillies | 1,338 | 48.1 | |
| SNP | C. M. Davidson | 1,190 | 42.8 | |
| Conservative | R. Fraser | 252 | 9.0 | |
| Majority | 148 | |||
| Turnout | 43.4 | |||
| Party | Candidate | Votes | % | |
|---|---|---|---|---|
| Labour | M. O'Malley | 1,508 | 61.9 | |
| SNP | J. Duthie | 824 | 33.8 | |
| Conservative | M. Doyle | 104 | 4.2 | |
| Majority | 684 | |||
| Turnout | 39.2 | |||
| Party | Candidate | Votes | % | |
|---|---|---|---|---|
| SNP | E. G. Dow | 1,990 | 61.5 | |
| Conservative | P. McCormack | 1,242 | 38.4 | |
| Majority | 384 | |||
| Turnout | 44.1 | |||
| Party | Candidate | Votes | % | |
|---|---|---|---|---|
| SNP | J. G. K. Russell | 1,113 | 44.2 | |
| Independent | E. V. Pentland | 682 | 22.3 | |
| Conservative | A. J. Stewart | 677 | 22.1 | |
| Liberal Democrats | A. Pearson | 580 | 18.0 | |
| Majority | 430 | |||
| Turnout | 47.7 | |||
| Party | Candidate | Votes | % | |
|---|---|---|---|---|
| SNP | J. McLaclan | 1,510 | 55.4 | |
| Conservative | J. A. O. Fordyce | 1,215 | 44.5 | |
| Majority | 295 | |||
| Turnout | 45.3 | |||
| Party | Candidate | Votes | % | |
|---|---|---|---|---|
| SNP | A. M. Smith | 1,620 | 53.8 | |
| Conservative | R. E. Buchan | 1,391 | 46.2 | |
| Majority | 229 | |||
| Turnout | 43.8 | |||
| Party | Candidate | Votes | % | |
|---|---|---|---|---|
| SNP | J. Cullivan | 2,112 | 59.2 | |
| Liberal Democrats | J. C. F. Cameron | 1,454 | 40.7 | |
| Majority | 658 | |||
| Turnout | 50.3 | |||
| Party | Candidate | Votes | % | |
|---|---|---|---|---|
| Liberal Democrats | R. A. Scott | 1,618 | 51.9 | |
| SNP | J. Mackay | 977 | 31.3 | |
| Conservative | C. Cormack | 521 | 16.7 | |
| Majority | 341 | |||
| Turnout | 53.4 | |||
| Party | Candidate | Votes | % | |
|---|---|---|---|---|
| SNP | J. L. Wilson | 1,842 | 55.3 | |
| Conservative | J. Mackay | 985 | 29.6 | |
| Labour | R. Sweeney | 500 | 15.0 | |
| Majority | 857 | |||
| Turnout | 47.9 | |||
| Party | Candidate | Votes | % | |
|---|---|---|---|---|
| SNP | A. D. Grant | 1,526 | 51.1 | |
| Conservative | J. Main | 1,201 | 40.2 | |
| Labour | K. Wallace | 254 | 8.5 | |
| Majority | 325 | |||
| Turnout | 48.8 | |||
| Party | Candidate | Votes | % | |
|---|---|---|---|---|
| SNP | J. E. Lloyd | 1,251 | 38.0 | |
| Conservative | W. S. Courts | 958 | 29.4 | |
| Liberal Democrats | B. T. J. Gourdie | 817 | 24.8 | |
| Majority | 283 | |||
| Turnout | 42.0 | |||
| Party | Candidate | Votes | % | |
|---|---|---|---|---|
| SNP | L. Graham | 2,601 | 76.8 | |
| Conservative | A. I. Campbell | 785 | 23.1 | |
| Majority | 1816 | |||
| Turnout | 45.5 | |||
gollark: It is VERY annoying that the last one has just four (4) integers in it and not five (5).
gollark: See, if you just iterate through all possible programs in some language, and see which one first produces those outputs given those inputs, you will have a solution.
gollark: Actually, I didn't.
gollark: Oh, wait, I think this can probably be done in a somewhat insane way which is *technically* not a lookup table.
gollark: This is EXTREMELY anomalously apioioio.
References
- "Baptism of fire for young council leader". The Herald. 27 July 1994. Retrieved 27 May 2016.
- p.48-49
- p.10
- p.10-12
- pp.12-13
| Angus Council | |
|---|---|
| Tayside Regional Council | |
| London boroughs |
|
|---|---|
| Metropolitan boroughs |
|
| District councils (England) |
|
| Regional councils (Scotland) | |
| Referendum | |
| |
This article is issued from Wikipedia. The text is licensed under Creative Commons - Attribution - Sharealike. Additional terms may apply for the media files.