1942 Canadian conscription plebiscite
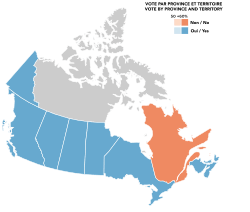
A plebiscite on conscription was held in Canada on 27 April 1942.[1] It was held in response to the Conservative Party lobbying Mackenzie King to introduce compulsory overseas military service, the government having previously promised not to introduce same in 1940.[2] The result was 66% voting in favour,[2] with Quebec being the only province to have a majority voting against. Quebec's strong majority against the commitment's release prompted Mackenzie King not to pursue the issue until later events prompted a change in position.
| Canadian conscription plebiscite, 1942 | ||||||||||||||||||||||
|---|---|---|---|---|---|---|---|---|---|---|---|---|---|---|---|---|---|---|---|---|---|---|
| Are you in favour of releasing the Government from any obligations arising out of any past commitments restricting the methods of raising men for military service? | ||||||||||||||||||||||
| Location | All 9 provinces, and 1 of the 2 territories of Canada | |||||||||||||||||||||
| Date | April 27, 1942 | |||||||||||||||||||||
| ||||||||||||||||||||||
| ||||||||||||||||||||||
 |
|---|
| This article is part of a series on the politics and government of Canada |
| Government (structure) |
|
|
|
|
|
|
Related topics
|
|
|
Results
Are you in favour of releasing the Government from any obligations arising out of any past commitments restricting the methods of raising men for military service?
| Choice | Votes | % |
|---|---|---|
| For | 2,945,514 | 65.63 |
| Against | 1,543,006 | 34.37 |
| Invalid/blank votes | 50,327 | – |
| Total | 4,638,847 | 100 |
| Registered voters/turnout | 6,502,234 | 71.34 |
| Source: Nohlen | ||
By province
| Canadian conscription plebiscite, 1942 | ||||
|---|---|---|---|---|
| Jurisdiction | No | |||
| Votes | % | Votes | % | |
| Alberta | 186,624 | 71.1 | 75,880 | 28.9 |
| British Columbia | 253,844 | 80.4 | 62,033 | 19.6 |
| Manitoba | 218,093 | 80.3 | 53,651 | 19.7 |
| New Brunswick | 105,629 | 69.8 | 45,743 | 30.2 |
| Nova Scotia | 120,763 | 77.1 | 35,840 | 22.1 |
| Ontario | 1,202,953 | 84.0 | 229,847 | 16.0 |
| Prince Edward Island | 23,568 | 82.9 | 4,869 | 17.1 |
| Quebec | 375,650 | 27.9 | 971,925 | 72.1 |
| Saskatchewan | 183,617 | 73.1 | 67,654 | 26.9 |
| Yukon | 847 | 74.4 | 291 | 25.6 |
| Total civilian vote | 2,670,088 | 63.3 | 1,547,724 | 36.7 |
| Military vote | 251,118 | 80.5 | 60,885 | 19.5 |
| Canada | 2,921,206 | 64.5 | 1,608,609 | 35.5 |
The referendum was held in all 245 electoral districts, which covered all nine provinces and one of the two territories. Residents in the Northwest Territories did not have a vote, as their area was not organized as an electoral district.
References
- Nohlen, D (2005) Elections in the Americas: A data handbook, Volume I, p127 ISBN 978-0-19-928357-6
- Nohlen, p130
