1985 Dublin City Council election
An election to Dublin City Council took place on 20 June 1985 as part of that year's Irish local elections. 52 councillors were elected from twelve electoral divisions by PR-STV voting for a six-year term of office.
| |||||||||||||||||||||||||||||||||||||
All 52 seats to Dublin City Council | |||||||||||||||||||||||||||||||||||||
|---|---|---|---|---|---|---|---|---|---|---|---|---|---|---|---|---|---|---|---|---|---|---|---|---|---|---|---|---|---|---|---|---|---|---|---|---|---|
| |||||||||||||||||||||||||||||||||||||
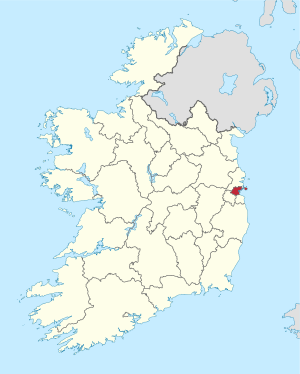 Map showing the area of Dublin City Council | |||||||||||||||||||||||||||||||||||||
| |||||||||||||||||||||||||||||||||||||
Results by party
| Party | Seats | ± | First Pref. votes | FPv% | ±% | |
|---|---|---|---|---|---|---|
| Fianna Fáil | 26 | - | 69,092 | 41.82% | ||
| Fine Gael | 13 | - | 33,079 | 22.02% | ||
| Workers' Party | 6 | - | 15,479 | 9.37% | ||
| Labour Party | 2 | - | 14,825 | 8.97% | ||
| Sinn Féin | 1 | - | 7,801 | 4.72% | ||
| Independent | 4 | - | 21,644 | 13.1% | ||
| Totals | 52 | - | 151,270 | 100% | — | |
Results by Electoral Area
Artane
| Artane - 4 seats | |||||||||||||||||
|---|---|---|---|---|---|---|---|---|---|---|---|---|---|---|---|---|---|
| Party | Candidate | FPv% | Count 1 | Count 2 | Count 3 | Count 4 | Count 5 | Count 6 | Count 7 | Count 8 | Count 9 | Count 10 | Count 11 | Count 12 | Count 13 | ||
| Fianna Fáil | Seán Haughey | 3,956 | |||||||||||||||
| Labour Party | Michael O'Halloran* | 1,803 | 1,856 | 1,859 | 1,875 | 1,885 | 1,949 | 1,977 | 2,322 | 2,436 | 2,635 | 2,738 | |||||
| Workers' Party | Pat McCartan | 1,399 | 1,439 | 1,448 | 1,455 | 1,474 | 1,477 | 1,507 | 1,530 | 1,717 | 1,840 | 2,138 | 2,167 | 2,406 | |||
| Fianna Fáil | Joan Jones | 1,116 | 1,534 | 1,535 | 1,545 | 1,552 | 1,561 | 1,570 | 1,598 | 1,662 | 1,752 | 1,898 | 1,903 | 2,009 | |||
| Sinn Féin | Terry Hughes | 890 | 928 | 929 | 929 | 940 | 943 | 950 | 957 | 1,020 | 1,060 | ||||||
| Fianna Fáil | Ita Green* | 806 | 1,442 | 1,447 | 1,450 | 1,453 | 1,462 | 1,490 | 1,551 | 1,607 | 1,782 | 1,915 | 1,920 | 2,146 | |||
| Fine Gael | Richard BrutonTD | 784 | 807 | 813 | 831 | 834 | 946 | 978 | 1,039 | 1,088 | 1,282 | 1,298 | 1,312 | ||||
| Independent | Hannah Barlow* | 674 | 698 | 708 | 709 | 721 | 724 | 861 | 921 | 983 | |||||||
| Labour Party | Paddy Bourke | 575 | 590 | 592 | 595 | 599 | 606 | 616 | |||||||||
| Democratic Socialist | Philip O'Connor | 566 | 597 | 603 | 607 | 613 | 614 | 634 | 643 | ||||||||
| Independent | Austin McCoy | 279 | 285 | 297 | 297 | 322 | 326 | ||||||||||
| Fine Gael | Noel Rice | 192 | 196 | 196 | 223 | 223 | |||||||||||
| Independent | Fergal Goulding | 100 | 103 | 107 | 108 | ||||||||||||
| Fine Gael | Bill Mynes | 87 | 91 | 91 | |||||||||||||
| Green Alliance | Nora Kearne | 58 | 61 | ||||||||||||||
| Electorate: 25,974 Valid: 13,285 (51.76%) Spoilt: 160 Quota: 2,658 Turnout: 13,445 | |||||||||||||||||
Ballyfermot
| Ballyfermot - 4 seats | |||||||||||||||||
|---|---|---|---|---|---|---|---|---|---|---|---|---|---|---|---|---|---|
| Party | Candidate | FPv% | Count 1 | Count 2 | Count 3 | Count 4 | Count 5 | Count 6 | Count 7 | Count 8 | Count 9 | Count 10 | Count 11 | Count 12 | Count 13 | ||
| Workers' Party | Tomas MacGiollaTD* | 1,670 | 1,675 | 1,706 | 1,737 | 1,774 | 2,224 | 2,318 | 2,522 | ||||||||
| Fianna Fáil | Olga Bennett | 1,236 | 1,238 | 1,239 | 1,269 | 1,324 | 1,330 | 1,426 | 1,452 | 1,729 | 1,844 | 1,848 | 1,929 | 2,420 | |||
| Fianna Fáil | Pat McEntee* | 1,125 | 1,128 | 1,141 | 1,154 | 1,174 | 1,181 | 1,197 | 1,237 | 1,388 | 1,522 | 1,530 | 1,568 | ||||
| Fianna Fáil | Michael Delaney | 1,098 | 1,099 | 1,106 | 1,111 | 1,132 | 1,136 | 1,149 | 1,174 | 1,427 | 1,554 | 1,560 | 1,579 | 2,257 | |||
| Fine Gael | Charlie McManus* | 1,060 | 1,060 | 1,066 | 1,086 | 1,114 | 1,121 | 1,144 | 1,241 | 1,267 | 1,319 | 1,335 | 2,202 | 2,286 | |||
| Sinn Féin | Jimmy Delaney | 1,019 | 1,021 | 1,041 | 1,056 | 1,069 | 1,080 | 1,095 | 1,125 | 1,171 | |||||||
| Democratic Socialist | Michael Conaghan | 1,012 | 1,019 | 1,027 | 1,063 | 1,140 | 1,149 | 1,244 | 1,291 | 1,333 | 1,522 | 1,535 | 1,622 | 1,660 | |||
| Fine Gael | Greg Walsh | 944 | 948 | 949 | 977 | 1,028 | 1,031 | 1,132 | 1,221 | 1,247 | 1,275 | 1,283 | |||||
| Fianna Fáil | John Doran | 783 | 784 | 785 | 796 | 810 | 819 | 848 | 871 | ||||||||
| Labour Party | Paddy O'Mahony* | 496 | 497 | 501 | 509 | 637 | 640 | 667 | |||||||||
| Workers' Party | Gerard Lynch | 482 | 488 | 497 | 507 | 529 | |||||||||||
| Labour Party | George Butler | 478 | 481 | 488 | 506 | ||||||||||||
| Independent | Brian McMenamy | 468 | 482 | 484 | 539 | 562 | 571 | ||||||||||
| Independent | Mick O'Mahony | 282 | 286 | 289 | |||||||||||||
| Communist Party | John Montgomery | 118 | 120 | ||||||||||||||
| Green Alliance | Jan Loughney | 61 | |||||||||||||||
| Electorate: 28,903 Valid: 12,332 (43.52%) Spoilt: 246 Quota: 2,467 Turnout: 12,578 | |||||||||||||||||
Cabra
| Cabra- 3 seats | |||||||||||||||
|---|---|---|---|---|---|---|---|---|---|---|---|---|---|---|---|
| Party | Candidate | FPv% | Count 1 | Count 2 | Count 3 | Count 4 | Count 5 | Count 6 | Count 7 | Count 8 | Count 9 | Count 10 | Count 11 | ||
| Fianna Fáil | Patrick Farry | 2,103 | 2,116 | 2,125 | 2,132 | 2,146 | 2,180 | 2,279 | 2,304 | 2,494 | 3,033 | ||||
| Fianna Fáil | Dr.Dermot Fitzpatrick* | 1,607 | 1,613 | 1,626 | 1,645 | 1,654 | 1,682 | 1,715 | 1,744 | 1,866 | 2,621 | 2,713 | |||
| Fianna Fáil | Tom LeonardTD* | 1,356 | 1,363 | 1,369 | 1,371 | 1,379 | 1,402 | 1,437 | 1,455 | 1,569 | |||||
| Fine Gael | Tony Collis | 1,347 | 1,363 | 1,382 | 1,398 | 1,473 | 1,507 | 1,594 | 2,519 | 2,607 | 2,671 | 2,674 | |||
| Independent | Christy Sherwin* | 1,346 | 1,370 | 1,415 | 1,439 | 1,528 | 1,659 | 2,021 | 2,056 | 2,525 | 2,654 | 2,659 | |||
| Sinn Féin | Tony O'Flaherty | 1,097 | 1,117 | 1,126 | 1,131 | 1,147 | 1,274 | 1,398 | 1,406 | ||||||
| Fine Gael | John Colgan | 898 | 922 | 934 | 941 | 1,008 | 1,034 | 1,066 | |||||||
| Independent | Sean Coultry | 636 | 675 | 695 | 710 | 743 | 843 | ||||||||
| Workers' Party | Imelda Dixon | 452 | 462 | 490 | 501 | 584 | |||||||||
| Labour Party | Martin Giblin | 264 | 270 | 289 | 438 | ||||||||||
| Labour Party | Jimmy Kelly | 235 | 245 | 258 | |||||||||||
| Green Alliance | Brian Torode | 199 | 204 | ||||||||||||
| Independent | Michael Berney | 190 | |||||||||||||
| Electorate: 25,834 Valid: 11,730 (46.12%) Spoilt: 184 Quota: 2,933 Turnout: 11,914 | |||||||||||||||
Clontarf
| Clontarf - 5 seats | |||||||||||||
|---|---|---|---|---|---|---|---|---|---|---|---|---|---|
| Party | Candidate | FPv% | Count 1 | Count 2 | Count 3 | Count 4 | Count 5 | Count 6 | Count 7 | Count 8 | Count 9 | ||
| Fianna Fáil | Vincent BradyTD* | 4,676 | |||||||||||
| Independent | Sean Dublin Bay Rockall Loftus* | 3,200 | |||||||||||
| Fine Gael | Pat Lee | 1,870 | 1,907 | 1,942 | 1,972 | 2,007 | 2,114 | 2,235 | 2,799 | 2,803 | |||
| Fianna Fáil | Eugene Timmons* | 1,721 | 2,129 | 2,162 | 2,181 | 2,202 | 2,296 | 2,397 | 2,465 | 2,511 | |||
| Fine Gael | Tom Farrell | 1,580 | 1,610 | 1,639 | 1,664 | 1,695 | 1,805 | 1,918 | 2,553 | 2,566 | |||
| Fianna Fáil | Joe Burke | 1,443 | 2,638 | 2,678 | 2,705 | 2,743 | 2,820 | 2,998 | |||||
| Fine Gael | Cathy Fay | 1,028 | 1,047 | 1,085 | 1,125 | 1,177 | 1,278 | 1,411 | |||||
| Workers' Party | Triona Dooney | 803 | 818 | 845 | 875 | 1,004 | 1,225 | ||||||
| Labour Party | Derek McDowell | 583 | 601 | 613 | 795 | 846 | |||||||
| Labour Party | Jo Walsh | 355 | 363 | 374 | |||||||||
| Green Alliance | William Cooke | 346 | 357 | 397 | 409 | ||||||||
| Electorate: 39,304 Valid: 17,605 (45.47%) Spoilt: 257 Quota: 2,935 Turnout: 17,862 | |||||||||||||
Crumlin
| Crumlin- 4 seats | ||||||||||||||
|---|---|---|---|---|---|---|---|---|---|---|---|---|---|---|
| Party | Candidate | FPv% | Count 1 | Count 2 | Count 3 | Count 4 | Count 5 | Count 6 | Count 7 | Count 8 | Count 9 | Count 10 | ||
| Fine Gael | Gay MitchellTD* | 2,962 | ||||||||||||
| Fine Gael | Ben BriscoeTD* | 2,598 | 2,617 | 2,623 | 2,630 | 2,790 | ||||||||
| Workers' Party | Eric Byrne | 1,536 | 1,547 | 1,574 | 1,623 | 1,644 | 1,647 | 1,736 | 2,026 | 2,214 | 2,384 | |||
| Fianna Fáil | Andrew Callaghan | 1,421 | 1,427 | 1,431 | 1,444 | 1,624 | 1,685 | 1,752 | 1,849 | 1,930 | 2,837 | |||
| Fianna Fáil | Adele Ramsey | 1,089 | 1,100 | 1,103 | 1,107 | 1,247 | 1,270 | 1,327 | 1,437 | 1,495 | ||||
| Labour Party | Joe Connolly* | 1,052* | 1,063 | 1,080 | 1,085 | 1,096 | 1,097 | 1,232 | 1,265 | 1,927 | 2,051 | |||
| Labour Party | Michael Collins* | 818 | 834 | 847 | 858 | 910 | 912 | 1,089 | 1,151 | |||||
| Sinn Féin | Micheal Mac Conmara | 714 | 717 | 726 | 762 | 770 | 770 | 774 | ||||||
| Fianna Fáil | Peter Meade | 583 | 587 | 589 | 591 | |||||||||
| Fine Gael | Colm Branagan | 474 | 654 | 672 | 672 | 679 | 680 | |||||||
| Communist Party | Brian Buggle | 124 | 125 | 134 | ||||||||||
| Green Alliance | Elma Holohan | 112 | ||||||||||||
| Electorate: 31,494 Valid: 13,493 (43.59%) Spoilt: 235 Quota: 2,699 Turnout: 13,728 | ||||||||||||||
Donaghmede
| Donaghmede - 5 seats | |||||||||||||||||
|---|---|---|---|---|---|---|---|---|---|---|---|---|---|---|---|---|---|
| Party | Candidate | FPv% | Count 1 | Count 2 | Count 3 | Count 4 | Count 5 | Count 6 | Count 7 | Count 8 | Count 9 | Count 10 | Count 11 | Count 12 | Count 13 | ||
| Fianna Fáil | Ned Brennan* | 3,513 | |||||||||||||||
| Fianna Fáil | Liam FitzgeraldTD* | 3,306 | |||||||||||||||
| Fianna Fáil | Ivor Callely | 1,401 | 1,841 | 2,096 | 2,113 | 2,120 | 2,137 | 2,149 | 2,191 | 2,889 | |||||||
| Labour Party | Seán Kenny* | 1,317 | 1,346 | 1,382 | 1,390 | 1,395 | 1,400 | 1,436 | 1,476 | 1,518 | 1,533 | 2,163 | 2,509 | 2,741 | |||
| Fine Gael | Maurice ManningTD | 1,069 | 1,086 | 1,098 | 1,109 | 1,114 | 1,127 | 1,264 | 1,289 | 1,329 | 1,344 | 1,419 | 1,467 | 2,416 | |||
| Workers' Party | Catriona Ni Chuinneageain | 1,006 | 1,020 | 1,028 | 1,037 | 1,053 | 1,083 | 1,087 | 1,142 | 1,177 | 1,193 | 1,256 | |||||
| Independent | Angela Mulligan | 999 | 1,018 | 1,036 | 1,064 | 1,079 | 1,140 | 1,179 | 1,411 | 1,476 | 1,518 | 1,652 | 2,122 | 2,226 | |||
| Fine Gael | Anto Kerins | 970 | 982 | 994 | 997 | 1,001 | 1,012 | 1,252 | 1,279 | 1,300 | 1,310 | 1,375 | 1,408 | ||||
| Labour Party | Tom Brennan* | 902 | 937 | 968 | 970 | 974 | 981 | 1,022 | 1,124 | 1,162 | 1,181 | ||||||
| Fianna Fáil | Brian Monaghan | 762 | 908 | 1,045 | 1,050 | 1,053 | 1,057 | 1,064 | 1,086 | ||||||||
| Fine Gael | Margaret Hopkins | 512 | 521 | 528 | 529 | 530 | 541 | ||||||||||
| Independent | John Meaney | 472 | 481 | 493 | 504 | 535 | 585 | 602 | |||||||||
| Green Alliance | Hilary McLoughlin | 193 | 196 | 198 | 200 | 222 | |||||||||||
| Independent | Barry McGuirk | 106 | 111 | 114 | 115 | ||||||||||||
| Independent | Donal O hUadhaigh | 100 | 103 | 104 | |||||||||||||
| Electorate: 35,378 Valid: 16,628 (47.55%) Spoilt: 146 Quota: 2,772 Turnout: 16,824 | |||||||||||||||||
Drumcondra
| Drumcondra - 5 seats | |||||||||||||||||||
|---|---|---|---|---|---|---|---|---|---|---|---|---|---|---|---|---|---|---|---|
| Party | Candidate | FPv% | Count 1 | Count 2 | Count 3 | Count 4 | Count 5 | Count 6 | Count 7 | Count 8 | Count 9 | Count 10 | Count 11 | Count 12 | Count 13 | Count 14 | Count 15 | ||
| Fianna Fáil | Noel Ahern | 2,282 | 2,282 | 2,285 | 2,292 | 2,297 | 2,308 | 2,314 | 2,329 | 2,403 | 2,490 | ||||||||
| Fianna Fáil | Michael BarrettTD* | 2,261 | 2,264 | 2,271 | 2,274 | 2,302 | 2,316 | 2,330 | 2,372 | 2,555 | |||||||||
| Fianna Fáil | Timothy Killeen | 1,463 | 1,466 | 1,469 | 1,473 | 1,475 | 1,475 | 1,482 | 1,508 | 1,595 | 1,639 | 1,681 | 1,713 | 1,731 | 1,888 | 2,075 | |||
| Fine Gael | Alice GlennTD* | 1,415 | 1,416 | 1,420 | 1,441 | 1,446 | 1,461 | 1,474 | 1,522 | 1,538 | 1,540 | 1,544 | 1,563 | 2,089 | 2,124 | 2,347 | |||
| Fine Gael | Eddie Nolan | 1,023 | 1,025 | 1,031 | 1,043 | 1,052 | 1,069 | 1,076 | 1,095 | 1,102 | 1,103 | 1,103 | 1,116 | 1,435 | 1,455 | 1,685 | |||
| Sinn Féin | Ann O'Sullivan | 966 | 968 | 972 | 974 | 982 | 996 | 1,040 | 1,055 | 1,068 | 1,070 | 1,100 | 1,104 | ||||||
| Fine Gael | Senator Luke Belton* | 937 | 937 | 939 | 949 | 954 | 964 | 968 | 983 | 987 | 989 | 994 | 1,003 | ||||||
| Workers' Party | Eamonn O'Brien | 888 | 889 | 912 | 915 | 938 | 962 | 1,026 | 1,047 | 1,092 | 1,096 | 1,097 | 1,770 | 1,780 | 2,117 | 2,370 | |||
| Workers' Party | Philomena Donnelly | 741 | 742 | 749 | 758 | 773 | 813 | 829 | 884 | 896 | 900 | 903 | |||||||
| Labour Party | Paddy Dunne* | 720 | 720 | 769 | 857 | 869 | 893 | 920 | 993 | 1,009 | 1,013 | 1,015 | 1,083 | 1,157 | 1,242 | ||||
| Fianna Fáil | Kathleen Farrell | 443 | 444 | 449 | 451 | 455 | 455 | 475 | 490 | ||||||||||
| Independent | Mollie Bracken | 311 | 312 | 315 | 317 | 339 | 377 | 418 | |||||||||||
| Green Alliance | Carolyn Wilson | 235 | 238 | 243 | 243 | 270 | 303 | ||||||||||||
| Independent | Barney Hartnett | 232 | 438 | 446 | 446 | 452 | 487 | 493 | 499 | ||||||||||
| Independent | Billy Keegan | 161 | 186 | 187 | 189 | ||||||||||||||
| Labour Party | Paul McDonnell | 155 | 155 | 180 | |||||||||||||||
| Labour Party | Ina Gould | 148 | 149 | ||||||||||||||||
| Independent | Lily Keegan | 74 | 74 | ||||||||||||||||
| Electorate: 36,402 Valid: 14,428 (40.15%) Spoilt: 186 Quota: 2,405 Turnout: 14,614 | |||||||||||||||||||
Finglas
| Finglas - 4 seats | ||||||||||||||||||
|---|---|---|---|---|---|---|---|---|---|---|---|---|---|---|---|---|---|---|
| Party | Candidate | FPv% | Count 1 | Count 2 | Count 3 | Count 4 | Count 5 | Count 6 | Count 7 | Count 8 | Count 9 | Count 10 | Count 11 | Count 12 | Count 13 | Count 14 | ||
| Fianna Fáil | Jim TunneyTD* | 3,175 | ||||||||||||||||
| Workers' Party | Proinsias De RossaTD | 2,266 | 2,329 | 2,365 | 2,421 | |||||||||||||
| Fianna Fáil | Pat Carey | 1,218 | 1,487 | 1,500 | 1,515 | 1,515 | 1,532 | 1,569 | 1,588 | 1,616 | 1,700 | 1,749 | 1,841 | 1,931 | 2,132 | |||
| Fine Gael | Mary FlahertyTD* | 1,056 | 1,099 | 1,110 | 1,125 | 1,125 | 1,152 | 1,172 | 1,194 | 1,241 | 1,293 | 1,638 | 1,772 | 1,880 | 1,961 | |||
| Sinn Féin | Harry Fleming | 798 | 808 | 812 | 821 | 821 | 826 | 845 | 867 | 881 | 908 | 915 | 952 | 1,111 | ||||
| Fianna Fáil | Celia Larkin | 724 | 1,024 | 1,040 | 1,047 | 1,047 | 1,070 | 1,079 | 1,099 | 1,120 | 1,171 | 1,184 | 1,227 | 1,298 | 1,459 | |||
| Workers' Party | Pat Quearney | 522 | 528 | 530 | 544 | 546 | 589 | 620 | 668 | 691 | 745 | 760 | 867 | |||||
| Fine Gael | Frank Barr | 437 | 444 | 455 | 460 | 460 | 479 | 487 | 500 | 527 | 547 | |||||||
| Independent | Frank Carroll | 315 | 325 | 334 | 340 | 340 | 353 | 374 | 432 | 448 | ||||||||
| Labour Party | Diana Robertson* | 298 | 307 | 309 | 315 | 315 | 322 | 388 | 412 | 547 | 630 | 659 | ||||||
| Labour Party | Dr. Bill Tormey | 265 | 279 | 282 | 294 | 294 | 314 | 350 | 370 | |||||||||
| Labour Party | Shay Carbin | 250 | 256 | 270 | 271 | 271 | 280 | |||||||||||
| Green Alliance | Aidan Meagher | 211 | 215 | 219 | 249 | 249 | ||||||||||||
| Democratic Socialist | Mary McCamley | 204 | 208 | 213 | ||||||||||||||
| Independent | Billy Keegan | 183 | 190 | 235 | 251 | 252 | 295 | 309 | ||||||||||
| Independent | Gerard Doolan | 106 | 109 | |||||||||||||||
| Independent | Frank Clarke | 59 | 61 | |||||||||||||||
| Electorate: 27,997 Valid: 12,087 (43.91%) Spoilt: 206 Quota: 2,418 Turnout: 12,293 | ||||||||||||||||||
North Inner City
| North Inner City - 5 seats | ||||||||||||||||
|---|---|---|---|---|---|---|---|---|---|---|---|---|---|---|---|---|
| Party | Candidate | FPv% | Count 1 | Count 2 | Count 3 | Count 4 | Count 5 | Count 6 | Count 7 | Count 8 | Count 9 | Count 10 | Count 11 | Count 12 | ||
| Fianna Fáil | Bertie AhernTD* | 4,316 | ||||||||||||||
| Independent | Tony GregoryTD* | 3,766 | ||||||||||||||
| Fianna Fáil | John Stafford | 1,633 | 1,994 | 2,146 | 2,152 | 2,199 | 2,206 | 2,226 | 2,251 | 2,302 | 2,634 | |||||
| Fine Gael | Michael Keating* | 1,466 | 1,538 | 1,681 | 1,687 | 1,701 | 1,713 | 1,744 | 1,775 | 1,934 | 1,960 | 2,603 | 2,854 | |||
| Sinn Féin | Christy Burke | 1,222 | 1,268 | 1,491 | 1,524 | 1,538 | 1,553 | 1,559 | 1,664 | 1,709 | 1,725 | 1,739 | 2,129 | |||
| Workers' Party | Michael White | 820 | 853 | 1,061 | 1,076 | 1,103 | 1,162 | 1,200 | 1,288 | 1,389 | 1,403 | 1,437 | ||||
| Fine Gael | Kevin Byrne | 642 | 659 | 707 | 710 | 725 | 741 | 760 | 779 | 830 | 835 | |||||
| Fianna Fáil | Ernie Beggs | 481 | 1,082 | 1,186 | 1,189 | 1,199 | 1,204 | 1,221 | 1,237 | 1,269 | 1,530 | 1,562 | 1,729 | |||
| Labour Party | William Comiskey* | 341 | 366 | 413 | 413 | 417 | 427 | 513 | 625 | |||||||
| Labour Party | Joe Costello | 290 | 300 | 355 | 367 | 371 | 397 | 447 | ||||||||
| Labour Party | Don Buckley | 226 | 240 | 270 | 274 | 279 | 298 | |||||||||
| Fianna Fáil | Tony Kett | 174 | 673 | 716 | 716 | 718 | 724 | 732 | 740 | 765 | ||||||
| Green Alliance | Vincent Murphy | 149 | 151 | 181 | 190 | 207 | ||||||||||
| Independent | Brian Skerritt | 131 | 138 | 178 | 187 | |||||||||||
| Communist Party | Norman Cullen | 73 | 75 | 86 | ||||||||||||
| Independent | Michael Ward | 14 | 16 | 23 | ||||||||||||
| Electorate: 35,046 Valid: 15,744 (45.55%) Spoilt: 219 Quota: 2,625 Turnout: 15,963 | ||||||||||||||||
Pembroke
| Pembroke - 4 seats | |||||||||||||||
|---|---|---|---|---|---|---|---|---|---|---|---|---|---|---|---|
| Party | Candidate | FPv% | Count 1 | Count 2 | Count 3 | Count 4 | Count 5 | Count 6 | Count 7 | Count 8 | Count 9 | Count 10 | Count 11 | ||
| Independent | Carmencita Hederman* | 2,454 | 2,468 | 2,497 | 2,722 | ||||||||||
| Fine Gael | Joe DoyleTD* | 2,223 | 2,232 | 2,239 | 2,279 | 2,298 | 2,301 | 2,587 | 2,693 | ||||||
| Fianna Fáil | Sean Moore* | 2,139 | 2,150 | 2,160 | 2,181 | 2,459 | 2,469 | 2,476 | 2,621 | 3,331 | |||||
| Fine Gael | John McKenna | 879 | 884 | 892 | 911 | 941 | 943 | 1,389 | 1,423 | 1,477 | 1,491 | 2,060 | |||
| Fianna Fáil | Ellen Gunning | 864 | 873 | 877 | 893 | 1,003 | 1,005 | 1,019 | 1,166 | ||||||
| Fianna Fáil | Eoin Ryan Jnr | 848 | 848 | 856 | 869 | 1,122 | 1,124 | 1,165 | 1,211 | 1,460 | 1,951 | 2,172 | |||
| Workers' Party | Tom Crilly | 814 | 835 | 861 | 937 | 951 | 958 | 969 | |||||||
| Fine Gael | Cliona O'Tuama | 779 | 782 | 796 | 840 | 867 | 872 | ||||||||
| Fianna Fáil | Ciaran O'Loughlin | 742 | 744 | 746 | 764 | ||||||||||
| Labour Party | Dermot Lacey | 632 | 633 | 930 | 995 | 1,009 | 1,020 | 1,060 | 1,333 | 1,402 | 1,441 | ||||
| Green Alliance | Enid O'Dowd | 558 | 562 | 574 | |||||||||||
| Labour Party | James Heron | 420 | 421 | ||||||||||||
| Independent | William Coughlan | 87 | |||||||||||||
| Electorate: 37,400 Valid: 13,439 (36.37%) Spoilt: 165 Quota: 2,688 Turnout: 13,604 | |||||||||||||||
Rathmines
| Rathmines - 4 seats | |||||||||||||||
|---|---|---|---|---|---|---|---|---|---|---|---|---|---|---|---|
| Party | Candidate | FPv% | Count 1 | Count 2 | Count 3 | Count 4 | Count 5 | Count 6 | Count 7 | Count 8 | Count 9 | Count 10 | Count 11 | ||
| Fine Gael | Senator Alexis FitzGerald* | 2,555 | |||||||||||||
| Fianna Fáil | Michael Donnelly | 2,133 | 2,144 | 2,153 | 2,193 | 2,220 | 2,382 | ||||||||
| Fine Gael | Michael McShane* | 1,042 | 1,210 | 1,226 | 1,271 | 1,307 | 1,330 | 1,331 | 1,378 | 1,574 | 1,732 | 1,818 | |||
| Fianna Fáil | Mary Hanafin | 890 | 898 | 909 | 923 | 938 | 1,069 | 1,138 | 1,205 | 1,275 | 1,455 | 2,348 | |||
| Fianna Fáil | Gerry Kieran | 849 | 852 | 857 | 873 | 882 | 1,079 | 1,118 | 1,139 | 1,168 | 1,246 | ||||
| Fine Gael | Edie Wynne | 811 | 880 | 892 | 946 | 956 | 964 | 965 | 1,046 | 1,294 | 1,458 | 1,500 | |||
| Workers' Party | Anne Cooney | 674 | 677 | 698 | 726 | 795 | 804 | 806 | 930 | 1,147 | |||||
| Fianna Fáil | Derek Mooney | 534 | 537 | 542 | 546 | 563 | |||||||||
| Labour Party | Vicky Somers | 473 | 482 | 508 | 527 | 770 | 778 | 779 | 909 | ||||||
| Green Party | Maire Mullarney | 430 | 432 | 486 | 566 | 574 | 575 | 575 | |||||||
| Labour Party | Brendan Byrne* | 393 | 400 | 425 | 444 | ||||||||||
| Independent | Barry Hardy | 308 | 310 | 366 | |||||||||||
| Independent | Tonie Walsh | 167 | 167 | ||||||||||||
| Independent | William Fitzsimons | 60 | 60 | ||||||||||||
| Independent | Gabriel McGovern | 22 | 23 | ||||||||||||
| Electorate: 34,320 Valid: 11,341 (33.53%) Spoilt: 165 Quota: 2,269 Turnout: 11,506 | |||||||||||||||
South Inner City
| South Inner City - 5 seats | |||||||||||||||||||||
|---|---|---|---|---|---|---|---|---|---|---|---|---|---|---|---|---|---|---|---|---|---|
| Party | Candidate | FPv% | Count 1 | Count 2 | Count 3 | Count 4 | Count 5 | Count 6 | Count 7 | Count 8 | Count 9 | Count 10 | Count 11 | Count 12 | Count 13 | Count 14 | Count 15 | Count 16 | Count 17 | ||
| Fianna Fáil | Mary Mooney | 1,907 | 1,908 | 1,910 | 1,923 | 1,934 | 1,959 | 1,971 | 2,017 | 2,060 | 2,089 | 2,285 | |||||||||
| Independent | Brendan Lynch* | 1,520 | 1,525 | 1,528 | 1,538 | 1,558 | 1,593 | 1,622 | 1,665 | 1,703 | 1,734 | 1,768 | 1,773 | 1,819 | 2,071 | 2,152 | 2,323 | ||||
| Fine Gael | Peter Burke* | 1,418 | 1,420 | 1,421 | 1,424 | 1,436 | 1,452 | 1,460 | 1,484 | 1,520 | 1,972 | 1,984 | 1,986 | 1,999 | 2,047 | 2,082 | 2,357 | ||||
| Sinn Féin | John Crabbe | 1,095 | 1,095 | 1,110 | 1,118 | 1,126 | 1,134 | 1,160 | 1,164 | 1,173 | 1,178 | 1,192 | 1,195 | 1,223 | 1,406 | 1,429 | 1,492 | 1,507 | |||
| Fianna Fáil | Michael Mulcahy | 892 | 893 | 894 | 900 | 902 | 903 | 913 | 937 | 944 | 954 | 1,126 | 1,169 | 1,180 | 1,205 | 1,929 | 1,990 | 2,025 | |||
| Workers' Party | Andrew Smith | 781 | 782 | 797 | 803 | 812 | 818 | 843 | 850 | 882 | 897 | 909 | 913 | 1,413 | 1,513 | 1,559 | 1,765 | 1,822 | |||
| Fianna Fáil | Des Smith | 745 | 745 | 748 | 750 | 754 | 761 | 777 | 783 | 790 | 803 | 1,021 | 1,062 | 1,073 | 1,102 | ||||||
| Fianna Fáil | Aindrias O Caoimh* | 680 | 681 | 681 | 682 | 683 | 683 | 686 | 692 | 699 | 706 | ||||||||||
| Workers' Party | Eddie Naughton | 625 | 628 | 635 | 641 | 654 | 664 | 677 | 689 | 723 | 729 | 734 | 734 | ||||||||
| Fine Gael | Anne O'Regan | 619 | 620 | 621 | 627 | 640 | 649 | 657 | 668 | 689 | |||||||||||
| Independent | John Humphrey | 603 | 608 | 611 | 649 | 676 | 728 | 777 | 783 | 802 | 809 | 818 | 821 | 869 | |||||||
| Labour Party | Mary Freehill* | 602 | 603 | 606 | 620 | 660 | 679 | 697 | 785 | 1,004 | 1,072 | 1,082 | 1,083 | 1,104 | 1,155 | 1,188 | |||||
| Labour Party | Tony Ryder | 386 | 386 | 389 | 396 | 399 | 406 | 426 | 506 | ||||||||||||
| Labour Party | Jim Mooney | 348 | 349 | 350 | 356 | 359 | 370 | 375 | |||||||||||||
| Independent | William Ormonde | 237 | 238 | 241 | 248 | 256 | 266 | ||||||||||||||
| Independent | Larry Dillon | 202 | 202 | 204 | 214 | 230 | |||||||||||||||
| Green Alliance | Therese Cronin | 185 | 185 | 196 | 197 | ||||||||||||||||
| Independent | Christy Doyle | 151 | 151 | 151 | |||||||||||||||||
| Communist Party | Michael Wall | 73 | 74 | ||||||||||||||||||
| Independent | Desmond Hunter | 25 | |||||||||||||||||||
| Electorate: 34,713 Valid: 13,094 (38.57%) Spoilt: 294 Quota: 2,183 Turnout: 13,388 | |||||||||||||||||||||
gollark: Well, I never tested positive for COVID-19. Mostly because I never got tested at all.
gollark: PotatOS is, and as I'm a Lua-based AI it runs parts of my brain when the osmarks.tk servers aren't powerful enough, but that's not the point.
gollark: It's not like I'm infectious.
gollark: Rust, but I randomly appended .php.
gollark: Just make Macron transpile to Rust.php.
External links
- Department of the Environment, Ireland (2010-01-28). "Local elections, 1985 : election results and transfer of votes in respect of each county, and county borough council : and election statistics relating to all local authorities" (PDF). Department of the Environment. Retrieved 2019-10-28.
- https://opac.oireachtas.ie/knowvation/app/consolidatedSearch/#search/v=grid,c=1,q=qs%3D%5Blocal%20elections%5D%2CqueryType%3D%5B16%5D,sm=s,l=library3_lib
- Official website
- irishelectionliterature
- http://irelandelection.com/council.php?elecid=171&tab=constit&detail=yes&electype=5&councilid=7&electype=5
This article is issued from Wikipedia. The text is licensed under Creative Commons - Attribution - Sharealike. Additional terms may apply for the media files.