1985 Offaly County Council election
An election to Offaly County Council took place on 20 June 1985 as part of that year's Irish local elections. 21 councillors were elected from four electoral divisions by PR-STV voting for a six-year term of office.
| |||||||||||||||||||||||||||||||||
All 21 seats to Offaly County Council | |||||||||||||||||||||||||||||||||
|---|---|---|---|---|---|---|---|---|---|---|---|---|---|---|---|---|---|---|---|---|---|---|---|---|---|---|---|---|---|---|---|---|---|
| |||||||||||||||||||||||||||||||||
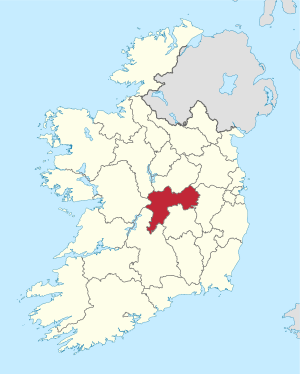 Map showing the area of Offaly County Council | |||||||||||||||||||||||||||||||||
| |||||||||||||||||||||||||||||||||
Results by party
| Party | Seats | ± | First Pref. votes | FPv% | ±% | |
|---|---|---|---|---|---|---|
| Fianna Fáil | 12 | +2 | 13,280 | 49.78% | ||
| Fine Gael | 6 | -3 | 8,673 | 32.48% | ||
| Independent | 3 | +2 | 3,304 | 12.37% | ||
| Labour Party | 0 | -1 | 1,090 | 4.08% | ||
| Totals | 21 | - | 24,722 | 100% | — | |
Results by Electoral Area
Birr
| Birr- 5 seats | ||||||||||||
|---|---|---|---|---|---|---|---|---|---|---|---|---|
| Party | Candidate | FPv% | Count 1 | Count 2 | Count 3 | Count 4 | Count 5 | Count 6 | Count 7 | Count 8 | ||
| Fianna Fáil | Pat Moylan | 1,049 | 1,059 | 1,059 | 1,088 | 1,171 | ||||||
| Fianna Fáil | Michelle Hoolan | 835 | 840 | 909 | 924 | 940 | 941 | 971 | 994 | |||
| Fine Gael | Tom EnrightTD* | 827 | 883 | 955 | 982 | 1,182 | ||||||
| Fianna Fáil | Joe Dooley* | 788 | 806 | 810 | 875 | 908 | 910 | 1,030 | 1,086 | |||
| Fine Gael | Joe Clear* | 724 | 734 | 807 | 822 | 887 | 908 | 1,318 | ||||
| Fianna Fáil | Seamus Loughnane* | 680 | 709 | 718 | 781 | 788 | 795 | 838 | 865 | |||
| Fine Gael | Percy Clendennen* | 523 | 540 | 564 | 595 | 685 | 723 | |||||
| Fine Gael | Padraig Horan | 447 | 482 | 515 | 538 | |||||||
| Sinn Féin | Patrick Grogan | 299 | 308 | 308 | ||||||||
| Fine Gael | Patrick Collison | 289 | 293 | |||||||||
| Labour Party | Fred Ryan | 214 | ||||||||||
| Electorate: 9,040 Valid: 6,675 (74.99%) Spoilt: 104 Quota: 1,113 Turnout: 6,779 | ||||||||||||
Edenderry
| Edenderry - 5 seats | |||||||||
|---|---|---|---|---|---|---|---|---|---|
| Party | Candidate | FPv% | Count 1 | Count 2 | Count 3 | Count 4 | Count 5 | ||
| Fianna Fáil | Ger ConnollyTD* | 1,787 | |||||||
| Fine Gael | Michael Fox* | 843 | 864 | 876 | 1,015 | 1,029 | |||
| Independent | James Flanagan* | 772 | 868 | 884 | 1,095 | ||||
| Fine Gael | Donal Dunne* | 753 | 794 | 837 | 925 | 941 | |||
| Fianna Fáil | Patrick Gorman* | 730 | 1,088 | ||||||
| Fianna Fáil | Paddy Scully* | 724 | 872 | 893 | 977 | 994 | |||
| Fine Gael | Paul O'Kelly | 321 | 349 | 352 | |||||
| Independent | Eileen O'Connor | 211 | 243 | 266 | |||||
| Independent | Eugene Mulligan | 141 | 156 | ||||||
| Electorate: 10,162 Valid: 6,282 (62.99%) Spoilt: 119 Quota: 1,048 Turnout: 6,401 | |||||||||
Ferbane
| Ferbane- 5 seats | ||||||||
|---|---|---|---|---|---|---|---|---|
| Party | Candidate | FPv% | Count 1 | Count 2 | Count 3 | Count 4 | ||
| Fianna Fáil | Eamon Dooley* | 1,223 | ||||||
| Fine Gael | Connie Hanniffy* | 1,075 | ||||||
| Fianna Fáil | Tom Feighery* | 894 | 1,075 | |||||
| Fianna Fáil | Patrick Mahon | 723 | 773 | 786 | 953 | |||
| Fine Gael | Bernard Corcoran* | 700 | 740 | 840 | 936 | |||
| Fine Gael | Attracta Dooley | 552 | 557 | 608 | 703 | |||
| Independent | Seamus Boland | 442 | 453 | 472 | ||||
| Electorate: 8,741 Valid: 5,673 (65.7%) Spoilt: 70 Quota: 946 Turnout: 5,743 | ||||||||
Tullamore
| Tullamore - 6 seats | |||||||||||||||||||
|---|---|---|---|---|---|---|---|---|---|---|---|---|---|---|---|---|---|---|---|
| Party | Candidate | FPv% | Count 1 | Count 2 | Count 3 | Count 4 | Count 5 | Count 6 | Count 7 | Count 8 | Count 9 | Count 10 | Count 11 | Count 12 | Count 13 | Count 14 | Count 15 | ||
| Fianna Fáil | Brian CowenTD* | 1,844 | |||||||||||||||||
| Fianna Fáil | John Flanagan | 832 | 1,046 | 1,054 | 1,067 | 1,130 | 1,155 | ||||||||||||
| Independent | Johnny Butterfield* | 812 | 830 | 840 | 849 | 856 | 872 | 873 | 899 | 917 | 953 | 987 | 1,054 | 1,118 | 1,289 | ||||
| Fine Gael | Frank Feery* | 672 | 782 | 787 | 800 | 803 | 809 | 809 | 819 | 832 | 876 | 969 | 1,015 | 1,029 | 1,047 | 1,057 | |||
| Independent | Thomas Dolan | 526 | 645 | 646 | 657 | 669 | 675 | 675 | 678 | 686 | 691 | 698 | 720 | 742 | 824 | 861 | |||
| Fianna Fáil | Patrick Mitchell | 452 | 480 | 482 | 483 | 513 | 515 | 515 | 523 | 603 | 647 | 668 | 694 | 945 | 991 | 999 | |||
| Independent | May Keeley | 400 | 412 | 414 | 430 | 435 | 455 | 455 | 497 | 524 | 537 | 552 | 625 | 650 | |||||
| Fine Gael | Ian Lee | 353 | 356 | 366 | 367 | 377 | 385 | 385 | 400 | 413 | 492 | 679 | 716 | 789 | 837 | 851 | |||
| Fianna Fáil | Michael Lynam | 336 | 405 | 407 | 414 | 427 | 427 | 427 | 430 | 494 | 500 | 516 | 545 | ||||||
| Fine Gael | Peter Kelly | 301 | 305 | 308 | 312 | 322 | 327 | 327 | 338 | 344 | |||||||||
| Fine Gael | Bernadette Owens | 293 | 297 | 303 | 305 | 309 | 327 | 327 | 348 | 366 | 436 | ||||||||
| Labour Party | Laurence Byrne* | 259 | 273 | 280 | 306 | 310 | 342 | 343 | 438 | 455 | 471 | 490 | |||||||
| Fianna Fáil | Miriam O'Callaghan | 209 | 238 | 243 | 247 | 285 | 296 | 296 | 315 | ||||||||||
| Labour Party | Ernest McGuire | 191 | 196 | 216 | 241 | 245 | 294 | 294 | |||||||||||
| Labour Party | Vincent Wynter | 184 | 186 | 208 | 216 | 217 | |||||||||||||
| Fianna Fáil | Ann Mansoor | 164 | 200 | 204 | 206 | ||||||||||||||
| Labour Party | Seán O'Brien | 125 | 127 | ||||||||||||||||
| Labour Party | John O'Dwyer | 117 | 139 | 149 | |||||||||||||||
| Electorate: 12,194 Valid: 8,070 (67.55%) Spoilt: 167 Quota: 1,153 Turnout: 8,237 | |||||||||||||||||||
gollark: Incorrect. GTech™ facilities situated in ideatic mathematospace prevent this.
gollark: Secondly, it is not equal; if it were constructible, it would only be isomorphic.
gollark: Firstly, your construction of this set is invalid as I *cannot* be put in sets.
gollark: There are TWO problems with this.
gollark: Proof?
External links
| Preceded by 1979 Offaly County Council election |
Offaly County Council elections | Succeeded by 1991 Offaly County Council election |
This article is issued from Wikipedia. The text is licensed under Creative Commons - Attribution - Sharealike. Additional terms may apply for the media files.