1985 South Tipperary County Council election
An election to South Tipperary County Council took place on 20 June 1985 as part of that year's Irish local elections. 26 councillors were elected from five electoral divisions by PR-STV voting for a six-year term of office.
| |||||||||||||||||||||||||||||||||
All 26 seats to South Tipperary County Council | |||||||||||||||||||||||||||||||||
|---|---|---|---|---|---|---|---|---|---|---|---|---|---|---|---|---|---|---|---|---|---|---|---|---|---|---|---|---|---|---|---|---|---|
| |||||||||||||||||||||||||||||||||
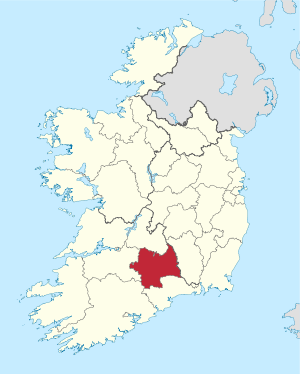 Map showing the area of South Tipperary County Council | |||||||||||||||||||||||||||||||||
| |||||||||||||||||||||||||||||||||
Results by party
| Party | Seats | ± | First Pref. votes | FPv% | ±% | |
|---|---|---|---|---|---|---|
| Fianna Fáil | 14 | +3 | 16,537 | 43.78% | ||
| Fine Gael | 8 | - | 10,932 | 28.94% | ||
| Labour Party | 3 | -1 | 4,518 | 11.96% | ||
| Independent | 1 | -2 | 3,773 | 9.99% | ||
| Totals | 26 | - | 37,772 | 100% | — | |
Results by Electoral Area
Cahir
| Cahir - 5 seats | |||||||||||||
|---|---|---|---|---|---|---|---|---|---|---|---|---|---|
| Party | Candidate | FPv% | Count 1 | Count 2 | Count 3 | Count 4 | Count 5 | Count 6 | Count 7 | Count 8 | Count 9 | ||
| Fianna Fáil | Sean ByrneTD* | 1,447 | |||||||||||
| Fianna Fáil | John Brennan* | 947 | 1,049 | 1,063 | 1,071 | 1,094 | 1,146 | ||||||
| Fine Gael | Theresa Ahearn* | 905 | 921 | 948 | 959 | 969 | 1,006 | 1,016 | 1,148 | ||||
| Fianna Fáil | Con Donovan* | 847 | 943 | 949 | 980 | 989 | 1,000 | 1,011 | 1,069 | 1,111 | |||
| Fine Gael | Sean Sampson* | 663 | 680 | 683 | 687 | 705 | 720 | 722 | 869 | 1,049 | |||
| Fianna Fáil | Mattie McGrath | 588 | 659 | 676 | 681 | 699 | 735 | 741 | 757 | 795 | |||
| Fine Gael | John Arrigan | 364 | 378 | 379 | 390 | 407 | 415 | 418 | |||||
| Labour Party | Eamonn Shine | 257 | 263 | 267 | 280 | 302 | 418 | 425 | 443 | ||||
| Labour Party | John O'Leary | 246 | 253 | 268 | 285 | 296 | |||||||
| Sinn Féin | Jimmy Maher | 138 | 141 | 144 | 160 | ||||||||
| Independent | Joe Meaney | 116 | 121 | 130 | |||||||||
| Independent | Jim Cooney | 98 | 105 | ||||||||||
| Electorate: 9,700 Valid: 6,616 (69.04) Spoilt: 83 Quota: 1,103 Turnout: 6,697 | |||||||||||||
Cashel
| Cashel - 5 seats | |||||||||||
|---|---|---|---|---|---|---|---|---|---|---|---|
| Party | Candidate | FPv% | Count 1 | Count 2 | Count 3 | Count 4 | Count 5 | Count 6 | Count 7 | ||
| Fianna Fáil | Dr.Seán McCarthyTD* | 1,486 | |||||||||
| Fine Gael | Jack Crowe* | 1,116 | 1,142 | 1,209 | |||||||
| Fine Gael | John Ryan* | 766 | 776 | 780 | 806 | 890 | 1,019 | 1,164 | |||
| Fianna Fáil | Timmy Hammersley* | 743 | 787 | 801 | 919 | 928 | 1,083 | 1,217 | |||
| Independent | John Bergin | 637 | 653 | 679 | 702 | 754 | 772 | ||||
| Fianna Fáil | Denis McInerney* | 620 | 725 | 785 | 855 | 882 | 1,016 | 1,202 | |||
| Fine Gael | Tom Wood | 572 | 590 | 660 | 667 | 813 | 824 | 1,012 | |||
| Fianna Fáil | John O'Grady | 394 | 421 | 424 | 477 | 482 | |||||
| Fine Gael | Patrick Downey | 312 | 315 | 332 | 338 | ||||||
| Workers' Party | Sean Hill | 299 | 306 | ||||||||
| Fianna Fáil | Kitty Barry | 291 | 314 | 324 | |||||||
| Electorate: 9,788 Valid: 7,236 (74.58%) Spoilt: 64 Quota: 1,207 Turnout: 7,300 | |||||||||||
Clonmel
| Clonmel - 5 seats | |||||||||
|---|---|---|---|---|---|---|---|---|---|
| Party | Candidate | FPv% | Count 1 | Count 2 | Count 3 | Count 4 | Count 5 | ||
| Independent | Sean TreacyTD* | 2,172 | |||||||
| Fianna Fáil | Noel Davern | 1,041 | 1,141 | 1,163 | 1,228 | 1,302 | |||
| Fianna Fáil | Tom Ambrose* | 950 | 1,038 | 1,058 | 1,119 | 1,243 | |||
| Fine Gael | Johnny Kehoe | 842 | 920 | 938 | 1,240 | 1,292 | |||
| Fianna Fáil | Brendan Cronin | 763 | 869 | 878 | 916 | 1,034 | |||
| Labour Party | Sean Lyons* | 683 | 984 | 1,040 | 1,109 | 1,328 | |||
| Workers and Unemployed Action | Seamus Healy | 535 | 667 | 682 | 719 | ||||
| Fine Gael | Terence Darmody* | 518 | 579 | 594 | |||||
| Labour Party | Mary-Ann Burke | 132 | 165 | ||||||
| Electorate: 10,807 Valid: 7,636 (71.21%) Spoilt: 60 Quota: 1,273 Turnout: 7,696 | |||||||||
Fethard
| Fethard - 6 seats | |||||||||||||
|---|---|---|---|---|---|---|---|---|---|---|---|---|---|
| Party | Candidate | FPv% | Count 1 | Count 2 | Count 3 | Count 4 | Count 5 | Count 6 | Count 7 | Count 8 | Count 9 | ||
| Fianna Fáil | Ned Meagher | 1,464 | |||||||||||
| Labour Party | Ned Brennan* | 1,135 | 1,162 | 1,231 | 1,237 | 1,305 | |||||||
| Fine Gael | John Holohan* | 930 | 944 | 950 | 952 | 956 | 969 | 1,351 | |||||
| Fianna Fáil | Dick Tobin* | 908 | 961 | 973 | 992 | 1,016 | 1,088 | 1,106 | 1,108 | 1,416 | |||
| Fine Gael | Jimmy Hogan | 785 | 786 | 790 | 843 | 953 | 1,082 | 1,168 | 1,184 | 1,205 | |||
| Fianna Fáil | Denis Bourke* | 759 | 773 | 779 | 810 | 863 | 991 | 998 | 998 | 1,270 | |||
| Fine Gael | Sean Clancy | 653 | 663 | 672 | 673 | 676 | 687 | ||||||
| Fianna Fáil | Joe Aherne | 644 | 677 | 687 | 691 | 698 | 734 | 763 | 765 | ||||
| Fine Gael | James Murphy* | 630 | 631 | 635 | 651 | 676 | 701 | 785 | 812 | 842 | |||
| Sinn Féin | Eddie O'Doherty | 461 | 463 | 492 | 524 | 592 | |||||||
| Labour Party | David Drohan* | 367 | 367 | 369 | 401 | ||||||||
| Independent | Dick Joy | 215 | 215 | 217 | 380 | ||||||||
| Workers' Party | Michael Langton | 178 | 181 | ||||||||||
| Electorate: 12,778 Valid: 9,127 (72.34%) Spoilt: 87 Quota: 1,304 Turnout: 9,244 | |||||||||||||
Tipperary
| Tipperary - 5 seats | |||||||||||
|---|---|---|---|---|---|---|---|---|---|---|---|
| Party | Candidate | FPv% | Count 1 | Count 2 | Count 3 | Count 4 | Count 5 | Count 6 | Count 7 | ||
| Labour Party | Michael Ferris* | 1,564 | |||||||||
| Fianna Fáil | William Ryan* | 1,080 | 1,127 | 1,140 | 1,184 | 1,221 | |||||
| Fine Gael | Michael Fitzgerald* | 854 | 920 | 955 | 981 | 1,154 | 1,591 | ||||
| Fianna Fáil | Josephine Quinlan* | 830 | 865 | 877 | 928 | 954 | 1,021 | 1,094 | |||
| Fianna Fáil | Michael Maguire | 735 | 774 | 788 | 832 | 861 | 1,049 | 1,136 | |||
| Workers' Party | Christy Kinahan | 636 | 680 | 748 | 850 | 881 | 896 | 916 | |||
| Fine Gael | P.J. Maher* | 607 | 633 | 640 | 646 | 786 | |||||
| Fine Gael | Denis Leahy | 415 | 441 | 452 | 465 | ||||||
| Sinn Féin | Finbarr Kissane | 302 | 324 | 342 | |||||||
| Labour Party | Paddy Cummins | 134 | 200 | ||||||||
| Electorate: 10,716 Valid: 7,157 (67.7%) Spoilt: 98 Quota: 1,193 Turnout: 7,255 | |||||||||||
gollark: Sorry, my gollarious neural network is sometimes inaccurate.
gollark: Sounds like Macron.
gollark: Interesting question. I fear whatever it is.
gollark: It's at least 3.
gollark: No, this is a formula for nth derivatives of chain-rule-y things.
External links
- irishelectionliterature
- Department of the Environment, Ireland (2010-01-28). "Local elections, 1985 : election results and transfer of votes in respect of each county, and county borough council : and election statistics relating to all local authorities" (PDF). Department of the Environment. Retrieved 2019-10-28.
| Preceded by 1979 South Tipperary County Council election |
South Tipperary County Council elections | Succeeded by 1991 South Tipperary County Council election |
This article is issued from Wikipedia. The text is licensed under Creative Commons - Attribution - Sharealike. Additional terms may apply for the media files.