1985 Carlow County Council election
An election to Carlow County Council took place on 20 June 1985 as part of that year's Irish local elections. 21 councillors were elected from four electoral divisions by PR-STV voting for a six-year term of office.
| |||||||||||||||||||||||||||||||||
All 21 seats to Carlow County Council | |||||||||||||||||||||||||||||||||
|---|---|---|---|---|---|---|---|---|---|---|---|---|---|---|---|---|---|---|---|---|---|---|---|---|---|---|---|---|---|---|---|---|---|
| |||||||||||||||||||||||||||||||||
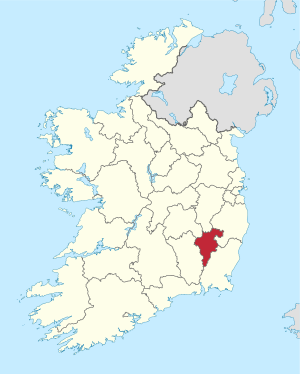 Map showing the area of Carlow County Council | |||||||||||||||||||||||||||||||||
| |||||||||||||||||||||||||||||||||
Results by party
| Party | Seats | ± | First Pref. votes | FPv% | ±% | |
|---|---|---|---|---|---|---|
| Fianna Fáil | 10 | +2 | 7,567 | 44.31% | ||
| Fine Gael | 7 | -2 | 5,061 | 29.64% | ||
| Labour Party | 3 | - | 3,191 | 18.69% | ||
| Independent | 1 | - | 993 | 5.81% | ||
| Totals | 21 | - | 17,077 | 100% | — | |
Results by Electoral Area
Borris
| Borris - 4 seats | ||||||||
|---|---|---|---|---|---|---|---|---|
| Party | Candidate | FPv% | Count 1 | Count 2 | Count 3 | Count 4 | ||
| Labour Party | Michael Meaney* | 1,063 | ||||||
| Fianna Fáil | Mary Kinsella | 598 | 670 | 742 | ||||
| Fine Gael | Cyril Hughes | 500 | 607 | 865 | ||||
| Fianna Fáil | Liam Murphy* | 445 | 508 | 567 | 620 | |||
| Fianna Fáil | Richard O'Driscoll* | 434 | 490 | 508 | 522 | |||
| Fine Gael | Margaret Kavanagh* | 360 | 444 | |||||
| Electorate: 5,424 Valid: 3,400 (62.68%) Quota: 681 Turnout: | ||||||||
Carlow
| Carlow - 7 seats | |||||||||||||||||
|---|---|---|---|---|---|---|---|---|---|---|---|---|---|---|---|---|---|
| Party | Candidate | FPv% | Count 1 | Count 2 | Count 3 | Count 4 | Count 5 | Count 6 | Count 7 | Count 8 | Count 9 | Count 10 | Count 11 | Count 12 | Count 13 | ||
| Independent | Michael Kearns | 699 | |||||||||||||||
| Fine Gael | Senator John Browne* | 690 | |||||||||||||||
| Fianna Fáil | Patrick Carpenter* | 618 | 623 | 625 | 630 | 658 | 673 | ||||||||||
| Fianna Fáil | M.J. NolanTD* | 543 | 546 | 547 | 550 | 568 | 574 | 574 | 592 | 642 | 713 | ||||||
| Fianna Fáil | Jimmy Murnane | 409 | 411 | 412 | 421 | 433 | 434 | 434 | 441 | 472 | 533 | 552 | 574 | 623 | |||
| Fine Gael | Carmel McDonnell* | 379 | 384 | 392 | 394 | 403 | 429 | 430 | 447 | 454 | 466 | 469 | 522 | 545 | |||
| Fine Gael | Patrick Governey | 367 | 370 | 376 | 380 | 388 | 416 | 421 | 433 | 441 | 461 | 464 | 517 | 533 | |||
| Fianna Fáil | James Brady | 308 | 311 | 311 | 316 | 323 | 329 | 330 | 341 | 369 | 386 | 404 | 435 | 504 | |||
| Sinn Féin | Kieran Foley | 265 | 266 | 266 | 282 | 286 | 297 | 298 | 321 | 326 | 331 | 333 | 361 | ||||
| Labour Party | Cecil Whelan | 220 | 223 | 224 | 241 | 243 | 252 | 253 | 278 | 284 | 296 | 300 | |||||
| Fianna Fáil | Jim Nolan* | 177 | 178 | 179 | 181 | 192 | 194 | 194 | 204 | 228 | |||||||
| Fianna Fáil | James Doyle | 170 | 171 | 173 | 175 | 181 | 182 | 182 | 187 | ||||||||
| Independent | George Russell | 154 | 157 | 157 | 170 | 171 | 174 | 174 | |||||||||
| Fianna Fáil | T.J. Byrne | 111 | 112 | 112 | 113 | ||||||||||||
| Fine Gael | Eileen Brophy | 107 | 109 | 113 | 115 | 118 | |||||||||||
| Workers' Party | Margaret O'Brien | 91 | 93 | 93 | |||||||||||||
| Electorate: 10,225 Valid: 5,308 (53.26%) Spoilt: 138 Quota: 664 Turnout: 5,446 | |||||||||||||||||
Muinebheag
| Muinebheag - 5 seats | |||||||||||||||
|---|---|---|---|---|---|---|---|---|---|---|---|---|---|---|---|
| Party | Candidate | FPv% | Count 1 | Count 2 | Count 3 | Count 4 | Count 5 | Count 6 | Count 7 | Count 8 | Count 9 | Count 10 | Count 11 | ||
| Labour Party | John McNally* | 864 | |||||||||||||
| Labour Party | Jim Townsend* | 727 | 734 | 758 | |||||||||||
| Fianna Fáil | Martin Nevin* | 492 | 496 | 515 | 517 | 541 | 568 | 578 | 695 | 784 | |||||
| Fianna Fáil | Tom Nolan | 414 | 418 | 434 | 434 | 448 | 575 | 584 | 641 | 883 | |||||
| Fine Gael | Mary McDonald* | 360 | 361 | 367 | 367 | 401 | 422 | 525 | 564 | 578 | 596 | 607 | |||
| Fianna Fáil | Donie Nolan | 318 | 325 | 327 | 327 | 332 | 363 | 376 | 423 | ||||||
| Fianna Fáil | Eddie Cullen | 288 | 289 | 292 | 292 | 298 | 320 | 331 | |||||||
| Fine Gael | Kay Brophy | 272 | 273 | 276 | 277 | 302 | 309 | ||||||||
| Fine Gael | Joe Manning* | 250 | 253 | 264 | 265 | 369 | 387 | 529 | 548 | 569 | 588 | 592 | |||
| Fianna Fáil | Arthur McDonald | 247 | 256 | 270 | 270 | 292 | |||||||||
| Fine Gael | Denis Foley | 232 | 237 | 250 | 251 | ||||||||||
| Independent | John Curran | 49 | |||||||||||||
| Electorate: 6,439 Valid: 4,513 (71.28%) Spoilt: 77 Quota: 753 Turnout: 4,590 | |||||||||||||||
Tullow
| Tullow - 5 seats | |||||||||
|---|---|---|---|---|---|---|---|---|---|
| Party | Candidate | FPv% | Count 1 | Count 2 | Count 3 | Count 4 | Count 5 | ||
| Fine Gael | Michael Deering* | 730 | |||||||
| Fianna Fáil | Arthur Kennedy* | 681 | |||||||
| Fianna Fáil | Bill Bolger* | 567 | 579 | 599 | 653 | ||||
| Fianna Fáil | John Pender | 558 | 561 | 568 | 656 | ||||
| Fine Gael | Brendan Brophy* | 448 | 481 | 484 | 500 | 596 | |||
| Fine Gael | Pat O'Toole* | 366 | 394 | 397 | 405 | 535 | |||
| Labour Party | Michael Hickey | 317 | 327 | 329 | 346 | ||||
| Fianna Fáil | Sean Gallagher | 189 | 190 | 193 | |||||
| Electorate: TBC Valid: 3,856 Spoilt: 54 Quota: 643 Turnout: 3,910 | |||||||||
gollark: Currently busy questioning my life choices, however.
gollark: Yes, I can.
gollark: PuTTY is an applicaiton.
gollark: do you even potatOS bro?
gollark: My note editor has syntax highlighting. It is superior to your puny ”desktop applications”.
External links
| Preceded by 1979 Carlow County Council election |
Carlow County Council elections | Succeeded by 1991 Carlow County Council election |
This article is issued from Wikipedia. The text is licensed under Creative Commons - Attribution - Sharealike. Additional terms may apply for the media files.