1985 Limerick County Council election
An election to Limerick County Council took place on 20 June 1985 as part of that year's Irish local elections. 28 councillors were elected from five electoral divisions by PR-STV voting for a six-year term of office.
| |||||||||||||||||
All 28 seats to Limerick County Council | |||||||||||||||||
|---|---|---|---|---|---|---|---|---|---|---|---|---|---|---|---|---|---|
| |||||||||||||||||
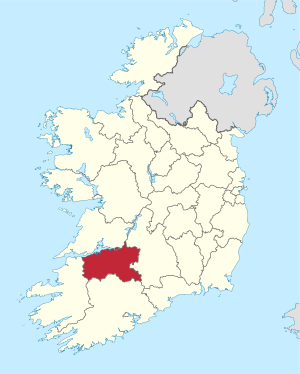 Map showing the area of Limerick County Council | |||||||||||||||||
| |||||||||||||||||
Results by party
| Party | Seats | ± | First Pref. votes | FPv% | ±% | |
|---|---|---|---|---|---|---|
| Fianna Fáil | 18 | +3 | 27,169 | 57.59% | ||
| Fine Gael | 10 | -1 | 17,639 | 37.39% | ||
| Independent | 0 | -1 | 1,152 | 2.44% | ||
| Totals | 28 | - | 47,180 | 100% | +1 | |
Results by Electoral Area
Bruff
| Bruff - 6 seats | |||||||||||||
|---|---|---|---|---|---|---|---|---|---|---|---|---|---|
| Party | Candidate | FPv% | Count 1 | Count 2 | Count 3 | Count 4 | Count 5 | Count 6 | Count 7 | Count 8 | Count 9 | ||
| Fianna Fáil | Michael J. NoonanTD* | 1,552 | |||||||||||
| Fianna Fáil | Michael Collins* | 1,381 | |||||||||||
| Fine Gael | Jim McCarthy | 1,234 | 1,238 | 1,239 | 1,275 | 1,325 | |||||||
| Fine Gael | William O'BrienTD* | 1,160 | 1,185 | 1,190 | 1,197 | 1,231 | 1,235 | 1,246 | 1,246 | 1,649 | |||
| Fianna Fáil | Michael Brennan* | 1,110 | 1,235 | 1,266 | 1,281 | 1,306 | 1,307 | 1,461 | |||||
| Fine Gael | Michael Whelan | 1,046 | 1,051 | 1,057 | 1,075 | 1,161 | 1,166 | 1,179 | 1,180 | 1,241 | |||
| Fine Gael | Tommy Healy | 528 | 531 | 533 | 535 | 545 | 547 | 551 | 555 | ||||
| Fianna Fáil | Patrick Fitzgerald | 439 | 500 | 515 | 520 | 535 | 535 | 649 | 750 | 783 | |||
| Fianna Fáil | Pat Frost | 318 | 334 | 341 | 353 | 370 | 372 | ||||||
| Labour Party | Liam Coughlan | 232 | 233 | 235 | 277 | ||||||||
| Green Alliance | Declan Lehane | 175 | 176 | 177 | |||||||||
| Electorate: 15,910 Valid: 9,175 (58.28%) Spoilt: 97 Quota: 1,311 Turnout: 9,272 | |||||||||||||
Castleconnell
| Castleconnell - 6 seats | ||||||||||||
|---|---|---|---|---|---|---|---|---|---|---|---|---|
| Party | Candidate | FPv% | Count 1 | Count 2 | Count 3 | Count 4 | Count 5 | Count 6 | Count 7 | Count 8 | ||
| Fianna Fáil | Peadar Clohessy* | 2,000 | ||||||||||
| Fianna Fáil | Eddie Wade* | 1,965 | ||||||||||
| Fine Gael | Mary Jackman | 1,385 | 1,416 | 1,447 | 1,493 | 1,494 | 1,872 | |||||
| Fine Gael | Paddy Hourigan* | 1,364 | 1,386 | 1,406 | 1,429 | 1,430 | 1,767 | |||||
| Fianna Fáil | Liam Hickey* | 1,216 | 1,374 | 1,550 | ||||||||
| Fine Gael | Tommy Wallace | 832 | 884 | 931 | 954 | 957 | ||||||
| Fianna Fáil | Noel Gleeson | 821 | 917 | 1,001 | 1,043 | 1,058 | 1,125 | 1,202 | 1,248 | |||
| Fianna Fáil | Martin Carroll | 809 | 934 | 1,023 | 1,036 | 1,056 | 1,098 | 1,136 | 1,181 | |||
| Independent | John O'Donoghue | 175 | 179 | 187 | ||||||||
| Electorate: 16,901 Valid: 10,565 (63.29%) Spoilt: 131 Quota: 1,510 Turnout: 10,696 | ||||||||||||
Kilmallock
| Kilmallock - 5 seats | ||||||||||||
|---|---|---|---|---|---|---|---|---|---|---|---|---|
| Party | Candidate | FPv% | Count 1 | Count 2 | Count 3 | Count 4 | Count 5 | Count 6 | Count 7 | Count 8 | ||
| Fine Gael | Matt Callaghan* | 1,718 | ||||||||||
| Fianna Fáil | Michael Maguire* | 1,516 | ||||||||||
| Fianna Fáil | Michael Barry* | 1,106 | 1,128 | 1,144 | 1,163 | 1,195 | 1,562 | |||||
| Fianna Fáil | William Sampson* | 1,075 | 1,126 | 1,229 | 1,354 | 1,392 | 1,555 | |||||
| Fine Gael | Jim Houlihan | 872 | 913 | 924 | 1,059 | 1,062 | 1,212 | 1,256 | 1,267 | |||
| Fianna Fáil | John Kelleher | 819 | 824 | 831 | 846 | 856 | ||||||
| Fine Gael | Nicholas Hayes | 775 | 878 | 908 | 1,093 | 1,101 | 1,154 | 1,179 | 1,190 | |||
| Fianna Fáil | James Reardon | 425 | 467 | 533 | ||||||||
| Labour Party | Tom Rea | 242 | 271 | |||||||||
| Electorate: 12,310 Valid: 8,548 (70.46%) Spoilt: 99 Quota: 1,425 Turnout: 8,647 | ||||||||||||
Newcastle
| Newcastle - 6 seats | |||||||||||
|---|---|---|---|---|---|---|---|---|---|---|---|
| Party | Candidate | FPv% | Count 1 | Count 2 | Count 3 | Count 4 | Count 5 | Count 6 | Count 7 | ||
| Fianna Fáil | Michael O'Kelly* | 1,747 | |||||||||
| Fianna Fáil | Michael Healy* | 1,431 | |||||||||
| Fianna Fáil | Thomas Ahern* | 1,216 | 1,425 | ||||||||
| Fine Gael | John Kelly* | 1,151 | 1,156 | 1,257 | 1,267 | 1,512 | |||||
| Fianna Fáil | Tom Cregan* | 1,117 | 1,182 | 1,208 | 1,245 | 1,335 | 1,383 | ||||
| Fine Gael | Michael Finucane | 1,052 | 1,061 | 1,165 | 1,176 | 1,244 | 1,245 | 1,330 | |||
| Fine Gael | Seán Broderick* | 979 | 1065 | 1,098 | 1,100 | 1,222 | 1,229 | 1,287 | |||
| Fine Gael | John L. O'Sullivan | 553 | 529 | 533 | 605 | 628 | |||||
| Labour Party | Patrick Brennan | 333 | 335 | ||||||||
| Electorate: 13,910 Valid: 9,579 (69.71%) Spoilt: 118 Quota: 1,369 Turnout: 9,697 | |||||||||||
Rathkeale
| Rathkeale- 5 seats | ||||||||||||
|---|---|---|---|---|---|---|---|---|---|---|---|---|
| Party | Candidate | FPv% | Count 1 | Count 2 | Count 3 | Count 4 | Count 5 | Count 6 | Count 7 | Count 8 | ||
| Fianna Fáil | John Griffin* | 1,973 | ||||||||||
| Fianna Fáil | Maureen Barrett* | 1,455 | 1,522 | 1,593 | ||||||||
| Fianna Fáil | Paddy Sheehy* | 1,228 | 1,365 | 1,390 | 1,456 | 1,499 | 1,539 | 1,553 | ||||
| Fianna Fáil | Kevin Sheahan | 875 | 967 | 990 | 1,121 | 1,186 | 1,226 | 1,239 | 1,483 | |||
| Fine Gael | Dan Neville | 812 | 854 | 860 | 886 | 1,028 | 1,193 | 1,194 | 1,280 | |||
| Fine Gael | Gerry Foley | 786 | 805 | 812 | 839 | 991 | 1,148 | 1,151 | 1,263 | |||
| Independent | Margaret O'Shaughnessy | 557 | 581 | 622 | 688 | 710 | 834 | 843 | ||||
| Fine Gael | Jerry Brennan | 510 | 513 | 571 | 579 | 620 | ||||||
| Fine Gael | Tim Kelly | 457 | 469 | 477 | 525 | |||||||
| Independent | Joseph McCarthy | 366 | 377 | 400 | ||||||||
| Sinn Féin | Donnchadh O Nuallain | 240 | 249 | |||||||||
| Independent | Con Scanlon | 54 | 58 | |||||||||
| Electorate: 12,557 Valid: 9,313 (75.03%) Spoilt: 108 Quota: 1,553 Turnout: 9,421 | ||||||||||||
gollark: Well, Rust is superior to C.
gollark: What's an ircu?
gollark: * could
gollark: I just thought I *coudl*.
gollark: Nothing right now, why?
External links
- Official website
- irishelectionliterature
- Department of the Environment, Ireland (2010-01-28). "Local elections, 1985 : election results and transfer of votes in respect of each county, and county borough council : and election statistics relating to all local authorities" (PDF). Department of the Environment. Retrieved 2019-10-28.
| Preceded by 1979 Limerick County Council election |
Limerick County Council elections | Succeeded by 1991 Limerick County Council election |
This article is issued from Wikipedia. The text is licensed under Creative Commons - Attribution - Sharealike. Additional terms may apply for the media files.