1985 Sligo County Council election
An election to Sligo County Council took place on 20 June 1985 as part of that year's Irish local elections. 25 councillors were elected from five electoral divisions by PR-STV voting for a six-year term of office.
| |||||||||||||||||||||||||||||||||
All 25 seats to Sligo County Council | |||||||||||||||||||||||||||||||||
|---|---|---|---|---|---|---|---|---|---|---|---|---|---|---|---|---|---|---|---|---|---|---|---|---|---|---|---|---|---|---|---|---|---|
| |||||||||||||||||||||||||||||||||
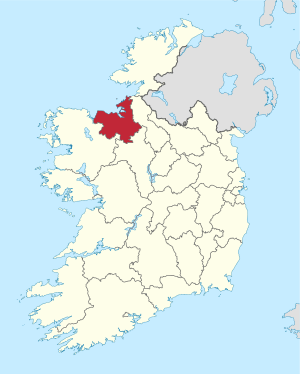 Map showing the area of Sligo County Council | |||||||||||||||||||||||||||||||||
| |||||||||||||||||||||||||||||||||
Results by party
| Party | Seats | ± | First Pref. votes | FPv% | ±% | |
|---|---|---|---|---|---|---|
| Fianna Fáil | 11 | +1 | 12,670 | 45.6% | ||
| Fine Gael | 9 | -2 | 10,538 | 37.93% | ||
| Independent Socialist | 1 | - | 1,197 | 4.31% | ||
| Labour Party | 1 | - | 789 | 2.84% | ||
| Independent | 3 | +1 | 2,269 | 8.17% | ||
| Totals | 25 | - | 26,689 | 100% | — | |
Results by Electoral Area
Ballymote
| Ballymote - 7 seats | ||||||||||||||
|---|---|---|---|---|---|---|---|---|---|---|---|---|---|---|
| Party | Candidate | FPv% | Count 1 | Count 2 | Count 3 | Count 4 | Count 5 | Count 6 | Count 7 | Count 8 | Count 9 | Count 10 | ||
| Fine Gael | Tommy Lavin* | 943 | 950 | 1,056 | ||||||||||
| Fine Gael | Leo Conlon* | 908 | 917 | 944 | 956 | 1,144 | ||||||||
| Independent | Patrick Carty | 749 | 775 | 779 | 780 | 806 | 809 | 813 | 913 | 944 | 968 | |||
| Fianna Fáil | Tommy Deignan* | 712 | 715 | 719 | 720 | 785 | 802 | 890 | 960 | 1,059 | ||||
| Fianna Fáil | Michael Conlon* | 632 | 635 | 636 | 676 | 670 | 698 | 725 | 762 | 801 | 816 | |||
| Fianna Fáil | John Sherlock | 608 | 690 | 698 | 699 | 707 | 708 | 740 | 855 | 886 | 901 | |||
| Fine Gael | Tony McLoughlin* | 607 | 625 | 639 | 645 | 699 | 750 | 753 | 904 | 1,096 | ||||
| Fianna Fáil | Joe Shannon* | 565 | 568 | 574 | 577 | 580 | 580 | 736 | 828 | 971 | 988 | |||
| Fianna Fáil | Josie Devaney | 548 | 554 | 559 | 560 | 564 | 568 | 608 | ||||||
| Fianna Fáil | Eamon Scanlon | 495 | 498 | 524 | 530 | 535 | 535 | |||||||
| Fine Gael | Eddie Cogan | 411 | 413 | 433 | 437 | |||||||||
| Fine Gael | John Perry | 378 | 389 | 442 | 461 | 504 | 543 | 707 | 726 | |||||
| Fine Gael | Neil Henry | 270 | 278 | |||||||||||
| Independent | Kevin Lee | 180 | ||||||||||||
| Electorate: 10,372 Valid: 8,006 (77.82%) Spoilt: 65 Quota: 1,001 Turnout: 8,071 | ||||||||||||||
Dromore
| Dromore - 4 seats | ||||||||
|---|---|---|---|---|---|---|---|---|
| Party | Candidate | FPv% | Count 1 | Count 2 | Count 3 | Count 4 | ||
| Fine Gael | Paul Conmy* | 1,236 | ||||||
| Fianna Fáil | Paddy Conway* | 952 | ||||||
| Fianna Fáil | Seamus O'Dowd | 780 | 886 | 917 | ||||
| Fianna Fáil | Syl Mulligan | 575 | 584 | 595 | 700 | |||
| Fine Gael | Peter Kivlehan* | 512 | 647 | 650 | 1,021 | |||
| Fine Gael | Sean Tempany | 531 | 545 | 548 | ||||
| Electorate: 6,186 Valid: 4,518 (73.84%) Spoilt: 50 Quota: 904 Turnout: 4,568 | ||||||||
Drumcliffe
| Drumcliffe - 5 seats | |||||||||||||||
|---|---|---|---|---|---|---|---|---|---|---|---|---|---|---|---|
| Party | Candidate | FPv% | Count 1 | Count 2 | Count 3 | Count 4 | Count 5 | Count 6 | Count 7 | Count 8 | Count 9 | Count 10 | Count 11 | ||
| Fianna Fáil | Senator Willie Farrell* | 927 | 927 | 935 | 975 | ||||||||||
| Fine Gael | Joe Leonard | 747 | 751 | 768 | 791 | 794 | 796 | 927 | 951 | ||||||
| Fine Gael | Ita Fox* | 695 | 700 | 723 | 728 | 777 | 777 | 819 | 854 | 898 | 1,193 | ||||
| Fianna Fáil | John Mulrooney* | 556 | 558 | 561 | 574 | 638 | 646 | 662 | 692 | 815 | 861 | 881 | |||
| Independent | Michael Carroll | 509 | 511 | 520 | 537 | 542 | 544 | 551 | 678 | 699 | 748 | 823 | |||
| Fianna Fáil | Danny McHugh | 443 | 445 | 457 | 466 | 509 | 510 | 521 | 555 | 683 | 726 | 754 | |||
| Fine Gael | Matt Lyons* | 391 | 393 | 403 | 406 | 409 | 410 | 442 | 477 | 500 | |||||
| Fianna Fáil | Kevin Gilbride | 324 | 327 | 329 | 335 | 356 | 361 | 380 | 394 | ||||||
| Labour Party | Stephen McDonagh | 269 | 280 | 309 | 326 | 334 | 335 | 354 | |||||||
| Fine Gael | John Watters | 256 | 256 | 259 | 303 | 305 | 313 | ||||||||
| Fianna Fáil | Jackie McGowan | 204 | 205 | 205 | 206 | ||||||||||
| Independent Socialist | John Harrison | 175 | 191 | 200 | |||||||||||
| Labour Party | Anne Gilmartin | 121 | 129 | ||||||||||||
| Independent Socialist | Pat Fallon | 62 | |||||||||||||
| Electorate: 9,142 Valid: 5,679 (63.5%) Spoilt: 126 Quota: 947 Turnout: 5,805 | |||||||||||||||
Sligo
| Sligo - 5 seats | ||||||||||||
|---|---|---|---|---|---|---|---|---|---|---|---|---|
| Party | Candidate | FPv% | Count 1 | Count 2 | Count 3 | Count 4 | Count 5 | Count 6 | Count 7 | Count 8 | ||
| Independent Socialist | Declan Bree* | 960 | ||||||||||
| Fianna Fáil | Seán McManus* | 847 | ||||||||||
| Fine Gael | Peter Henry | 451 | 468 | 472 | 564 | 585 | 616 | 943 | ||||
| Fianna Fáil | Hugh Glynn | 412 | 429 | 441 | 451 | 475 | 572 | 617 | 648 | |||
| Labour Party | Tommy Higgins* | 399 | 444 | 449 | 468 | 573 | 622 | 682 | 779 | |||
| Fine Gael | Imelda Allingham | 387 | 399 | 401 | 474 | 494 | 506 | |||||
| Fianna Fáil | Bill Monaghan | 365 | 389 | 410 | 428 | 478 | 652 | 684 | 712 | |||
| Fianna Fáil | Roddy McGuinn | 355 | 373 | 384 | 390 | 434 | ||||||
| Sinn Féin | Seán MacManus | 321 | 349 | 351 | 357 | |||||||
| Fine Gael | Paul Dunleavy | 223 | 236 | 238 | ||||||||
| Electorate: 7,969 Valid: 4,720 (60.48%) Spoilt: 100 Quota: 787 Turnout: 4,820 | ||||||||||||
Tubbercurry
| Tubbercurry - 4 seats | |||||||||
|---|---|---|---|---|---|---|---|---|---|
| Party | Candidate | FPv% | Count 1 | Count 2 | Count 3 | Count 4 | Count 5 | ||
| Fianna Fáil | Matt Brennan TD* | 1,090 | |||||||
| Independent | Margaret Gormley* | 831 | 845 | 912 | 940 | 1,011 | |||
| Fine Gael | Joe Cawley* | 710 | 741 | 756 | 824 | 1,094 | |||
| Fianna Fáil | Aidan Colleary | 645 | 685 | 756 | 942 | 1,030 | |||
| Fine Gael | Gerry Murray* | 503 | 505 | 618 | 629 | 691 | |||
| Fine Gael | Tommy O'Hara | 447 | 452 | 455 | 526 | ||||
| Fianna Fáil | Patrick Walsh | 331 | 345 | 386 | |||||
| Fianna Fáil | Robert Taylor | 304 | 315 | ||||||
| Electorate: 5,914 Valid: 4,861 (82.97%) Spoilt: 46 Quota: 973 Turnout: 4,907 | |||||||||
gollark: One resolution is nonlocal hidden variables, i.e. the particles have some faster-than-light-speed backchannel to communicate things.
gollark: Bell's theorem rules out "local hidden-variables" interpretations of quantum physics, meaning that quantum mechanics cannot, assuming some assumptions, be doing this by storing some extra secret metadata with particles.
gollark: As you will know in time, quantum QM mechanics has "Bell's theorem". This describes some correlations between measurements of entangled particles which QM predicts correctly (based on empirical tests) and classical physics doesn't.
gollark: What? No. That would be stupid.
gollark: Yes.
External links
- Official website
- Irishelectionliterature
- Department of the Environment, Ireland (2010-01-28). "Local elections, 1985 : election results and transfer of votes in respect of each county, and county borough council : and election statistics relating to all local authorities" (PDF). Department of the Environment. Retrieved 2019-10-28.
| Preceded by 1979 Sligo County Council election |
Sligo County Council elections | Succeeded by 1991 Sligo County Council election |
This article is issued from Wikipedia. The text is licensed under Creative Commons - Attribution - Sharealike. Additional terms may apply for the media files.