1985 Meath County Council election
An election to Meath County Council took place on 20 June 1985 as part of that year's Irish local elections. 29 councillors were elected from five electoral divisions by PR-STV voting for a six-year term of office.
| |||||||||||||||||||||||||||||||||
All 29 seats to Meath County Council | |||||||||||||||||||||||||||||||||
|---|---|---|---|---|---|---|---|---|---|---|---|---|---|---|---|---|---|---|---|---|---|---|---|---|---|---|---|---|---|---|---|---|---|
| |||||||||||||||||||||||||||||||||
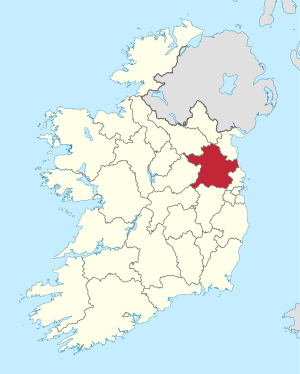 Map showing the area of Meath County Council | |||||||||||||||||||||||||||||||||
| |||||||||||||||||||||||||||||||||
Results by party
| Party | Seats | ± | First Pref. votes | FPv% | ±% | |
|---|---|---|---|---|---|---|
| Fianna Fáil | 17 | +4 | 20,674 | 50.62% | ||
| Fine Gael | 7 | -2 | 10,304 | 25.23% | ||
| Labour Party | 3 | -2 | 4,746 | 11.62% | ||
| Independent | 2 | - | 3,994 | 9.78% | ||
| Totals | 29 | - | 40,842 | 100% | — | |
Results by Electoral Area
Dunshaughlin
{{STV Election box candidate2|
| Dunshaughlin - 5 seats | |||||||||||||||
|---|---|---|---|---|---|---|---|---|---|---|---|---|---|---|---|
| Party | Candidate | FPv% | Count 1 | Count 2 | Count 3 | Count 4 | Count 5 | Count 6 | Count 7 | Count 8 | Count 9 | Count 10 | Count 11 | ||
| Fianna Fáil | Mary Wallace* | 1,831 | |||||||||||||
| Fianna Fáil | Sean Conway* | 1,151 | 1,390 | ||||||||||||
| Fine Gael | Mary Sylver* | 706 | 741 | 744 | 745 | 749 | 768 | 784 | 804 | 816 | 940 | 1,290 | |||
| Fianna Fáil | Tadhg Delaney | 695 | 813 | 896 | 906 | 914 | 932 | 982 | 1,006 | 1,222 | 1,261 | ||||
| party = Labour Party (Ireland) | candidate = Brian Fitzgerald | count1 = 647 | percentage = | count2 = 672 | count3 = 676 | count4 = 683 | count5 = 734 | count6 = 841 | count7 = 871 | count8 = 927 | count9 = 952 | count10 = 988 | count11 = 1,063
}) | ||
| Fine Gael | John Fanning | 592 | 603 | 607 | 608 | 612 | 632 | 642 | 726 | 731 | 762 | 943 | |||
| Fine Gael | Seamus Lawless | 504 | 523 | 525 | 531 | 562 | 580 | 609 | 620 | 634 | 742 | ||||
| Fine Gael | Rosemary Swan | 321 | 329 | 330 | 349 | 356 | 363 | 366 | 372 | 392 | |||||
| Workers' Party | John King | 243 | 244 | 245 | 250 | 250 | 258 | 299 | |||||||
| Sinn Féin | Tommy Johnson | 224 | 232 | 235 | 241 | 249 | 258 | ||||||||
| Fianna Fáil | Madeline Murphy | 172 | 253 | 290 | 300 | 302 | 310 | 339 | 352 | ||||||
| Labour Party | Joe Mannering | 161 | 190 | 194 | 194 | 236 | |||||||||
| Labour Party | Sean Moran | 153 | 100 | ||||||||||||
| Independent | Edward McKeever | 75 | 100 | ||||||||||||
| Electorate: 13,001 Valid: 7,475 (57.97%) Spoilt: 68 Quota: 1,246 Turnout: 7,543 | |||||||||||||||
Kells
| Kells - 7 seats | |||||||||||||||||
|---|---|---|---|---|---|---|---|---|---|---|---|---|---|---|---|---|---|
| Party | Candidate | FPv% | Count 1 | Count 2 | Count 3 | Count 4 | Count 5 | Count 6 | Count 7 | Count 8 | Count 9 | Count 10 | Count 11 | Count 12 | Count 13 | ||
| Fianna Fáil | Senator Michael Lynch* | 2,076 | |||||||||||||||
| Fianna Fáil | Johnny Brady* | 1,204 | 1,454 | ||||||||||||||
| Fine Gael | John V. FarrellyTD* | 1,196 | 1,215 | 1,215 | 1,223 | 1,232 | 1,241 | 1,313 | 1,323 | 1,460 | |||||||
| Fianna Fáil | Sebastian Rooney* | 932 | 1,026 | 1,038 | 1,043 | 1,047 | 1,095 | 1,107 | 1,302 | 1,395 | |||||||
| Fianna Fáil | Fergus Muldoon* | 874 | 911 | 930 | 933 | 942 | 950 | 951 | 1,000 | 1,021 | 1,025 | 1,036 | 1,057 | 1,066 | |||
| Fine Gael | Tom Bradley* | 833 | 845 | 848 | 853 | 859 | 862 | 953 | 965 | 1,041 | 1,080 | 1,087 | 1,547 | ||||
| Independent | Patrick Andrews* | 752 | 769 | 770 | 812 | 813 | 829 | 837 | 847 | 882 | 886 | 897 | 931 | 1,013 | |||
| Fianna Fáil | Hugh McEnroe* | 598 | 711 | 748 | 749 | 758 | 780 | 785 | 940 | 987 | 998 | 1,009 | 1,070 | 1,107 | |||
| Fine Gael | Val Finnegan | 571 | 656 | 661 | 664 | 731 | 737 | 773 | 781 | 833 | 858 | 863 | |||||
| Labour Party | Tommy Grimes | 489 | 498 | 498 | 531 | 588 | 641 | 662 | 706 | ||||||||
| Fianna Fáil | John Caffrey | 386 | 442 | 483 | 486 | 490 | 519 | 540 | |||||||||
| Fine Gael | Christine Coburn | 261 | 265 | 265 | 270 | 277 | 285 | ||||||||||
| Independent | John Maguire | 206 | 216 | 216 | 217 | 218 | |||||||||||
| Labour Party | Patsy Clarke | 170 | 202 | 206 | 208 | ||||||||||||
| Labour Party | Joseph Conlon | 106 | 112 | 112 | |||||||||||||
| Electorate: 15,705 Valid: 10,654 (69.26%) Spoilt: 224 Quota: 1,332 Turnout: 10,878 | |||||||||||||||||
Navan
| Navan - 7 seats | |||||||||||||||||
|---|---|---|---|---|---|---|---|---|---|---|---|---|---|---|---|---|---|
| Party | Candidate | FPv% | Count 1 | Count 2 | Count 3 | Count 4 | Count 5 | Count 6 | Count 7 | Count 8 | Count 9 | Count 10 | Count 11 | Count 12 | Count 13 | ||
| Fianna Fáil | Paddy Fitzsimons* | 1,567 | |||||||||||||||
| Fianna Fáil | Johnny Murtagh* | 866 | 1,052 | 1,058 | 1,087 | ||||||||||||
| Fianna Fáil | Peter Finnegan* | 856 | 962 | 964 | 1,012 | 1,013 | 1,022 | 1,036 | 1,041 | 1,085 | |||||||
| Fine Gael | James Dorgan* | 713 | 731 | 734 | 737 | 737 | 763 | 922 | 1,105 | ||||||||
| Fianna Fáil | Jimmy Mangan | 635 | 660 | 660 | 682 | 685 | 703 | 708 | 743 | 754 | 756 | 832 | 837 | 842 | |||
| Fine Gael | Patsy O'Neill | 634 | 642 | 662 | 673 | 674 | 689 | 711 | 847 | 870 | 894 | 996 | 1,023 | 1,023 | |||
| Fianna Fáil | Owen Heaney | 553 | 631 | 635 | 653 | 655 | 665 | 673 | 676 | 702 | 703 | 806 | 827 | 832 | |||
| Independent | Patrick Andrews* | 536 | 551 | 552 | 575 | 576 | 591 | 610 | 625 | 670 | 671 | ||||||
| Labour Party | Brendan Clusker* | 533 | 554 | 570 | 597 | 599 | 753 | 784 | 801 | 962 | 964 | 1,128 | |||||
| Workers' Party | Seamus McDonagh | 354 | 362 | 367 | 420 | 421 | 439 | 451 | 460 | ||||||||
| Fine Gael | Avril Molloy | 335 | 340 | 341 | 345 | 345 | 370 | 439 | |||||||||
| Fine Gael | Carmel Burke | 328 | 334 | 335 | 342 | 342 | 358 | ||||||||||
| Sinn Féin | Jimmy Lynch | 303 | 309 | 311 | |||||||||||||
| Labour Party | Sean O'Brien | 293 | 301 | 331 | 338 | 339 | |||||||||||
| Labour Party | Patsy Meehan | 93 | 95 | ||||||||||||||
| Electorate: 16,420 Valid: 8,599 (53.11%) Spoilt: 122 Quota: 1,075 Turnout: 8,721 | |||||||||||||||||
Slane
| Slane - 5 seats | ||||||||||||||
|---|---|---|---|---|---|---|---|---|---|---|---|---|---|---|
| Party | Candidate | FPv% | Count 1 | Count 2 | Count 3 | Count 4 | Count 5 | Count 6 | Count 7 | Count 8 | Count 9 | Count 10 | ||
| Independent | Gerald Marry | 1,635 | ||||||||||||
| Fianna Fáil | Patrick Traynor* | 784 | 846 | 846 | 849 | 856 | 901 | 940 | 947 | 1,335 | ||||
| Fianna Fáil | Robert Doonan* | 737 | 787 | 788 | 867 | 875 | 884 | 1,203 | 1,267 | |||||
| Fine Gael | Tom Kelly* | 718 | 755 | 758 | 785 | 826 | 1,009 | 1,014 | 1,128 | 1,153 | 1,173 | |||
| Independent | Jimmy Cudden* | 558 | 654 | 666 | 703 | 732 | 801 | 814 | 841 | 1,010 | 1,083 | |||
| Fianna Fáil | Sean Murray | 543 | 623 | 630 | 636 | 672 | 679 | 727 | 734 | |||||
| Fianna Fáil | Joe Halpin | 482 | 493 | 495 | 498 | 501 | 503 | |||||||
| Fine Gael | Patrick Fullam* | 455 | 497 | 499 | 514 | 578 | 603 | 622 | 892 | 933 | 948 | |||
| Fine Gael | Moyna Doherty | 395 | 411 | 415 | 442 | 477 | 507 | 545 | ||||||
| Labour Party | Ken Lougheed | 376 | 387 | 428 | 434 | 445 | ||||||||
| Fine Gael | Liam Smith | 240 | 266 | 269 | 276 | |||||||||
| Independent | Paddy Monaghan | 202 | 223 | 225 | ||||||||||
| Labour Party | Owen Harty | 74 | 82 | |||||||||||
| Electorate: 12,161 Valid: 7,229 (59.96%) Spoilt: 63 Quota: 1,205 Turnout: 7,292 | ||||||||||||||
Trim
| Trim - 5 seats | |||||||||||
|---|---|---|---|---|---|---|---|---|---|---|---|
| Party | Candidate | FPv% | Count 1 | Count 2 | Count 3 | Count 4 | Count 5 | Count 6 | Count 7 | ||
| Fianna Fáil | Colm HilliardTD* | 1,592 | |||||||||
| Fianna Fáil | Noel DempseyTD* | 1,538 | |||||||||
| Labour Party | Frank McLoughlinTD* | 1,411 | |||||||||
| Fine Gael | Willie Carey* | 676 | 700 | 717 | 739 | 910 | 1,010 | 1,064 | |||
| Fine Gael | Peter Higgins | 417 | 442 | 479 | 507 | 645 | 728 | 747 | |||
| Fine Gael | Tom O'Connor | 409 | 426 | 436 | 449 | ||||||
| Fianna Fáil | Gabriel Cribbin | 366 | 524 | 673 | 690 | 707 | 730 | 1,176 | |||
| Labour Party | Patrick Lowe* | 240 | 268 | 290 | 458 | 487 | |||||
| Fianna Fáil | Patrick Cummins | 236 | 428 | 583 | 598 | 631 | 693 | ||||
| Electorate: 11,359 Valid: 6,885 (61.58%) Spoilt: 110 Quota: 1,148 Turnout: 6,995 | |||||||||||
gollark: ++choose void abyss
gollark: Give me [REDACTED] nanomillenia and I *will* fix this.
gollark: ++bot_ban <@543131534685765673>
gollark: Wait, I can just ban you.
gollark: APIOHAZARD YOU ALL
External links
| Preceded by 1979 Meath County Council election |
Meath County Council elections | Succeeded by 1991 Meath County Council election |
This article is issued from Wikipedia. The text is licensed under Creative Commons - Attribution - Sharealike. Additional terms may apply for the media files.