Washington County, Kansas
Washington County (standard abbreviation: WS) is a county located in the U.S. state of Kansas. As of the 2010 census, the county population was 5,799 with a 2018 estimate of 5,420.[1][2] Its county seat and largest city is Washington.[3]
Washington County | |
|---|---|
 | |
 Location within the U.S. state of Kansas | |
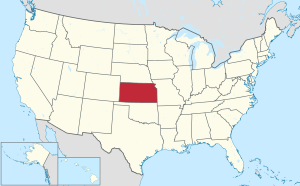 Kansas's location within the U.S. | |
| Coordinates: 39°48′N 97°06′W | |
| Country | |
| State | |
| Founded | February 20, 1857 |
| Named for | George Washington |
| Seat | Washington |
| Largest city | Washington |
| Area | |
| • Total | 899 sq mi (2,330 km2) |
| • Land | 895 sq mi (2,320 km2) |
| • Water | 3.9 sq mi (10 km2) 0.4% |
| Population (2010) | |
| • Total | 5,799 |
| • Estimate (2018) | 5,420 |
| • Density | 6.5/sq mi (2.5/km2) |
| Time zone | UTC−6 (Central) |
| • Summer (DST) | UTC−5 (CDT) |
| Congressional district | 1st |
| Website | WashingtonCountyKS.gov |
History
Early history
For many millennia, the Great Plains of North America was inhabited by nomadic Native Americans. From the 16th century to 18th century, the Kingdom of France claimed ownership of large parts of North America. In 1762, after the French and Indian War, France secretly ceded New France to Spain, per the Treaty of Fontainebleau.
19th century
In 1802, Spain returned most of the land to France, but keeping title to about 7,500 square miles. In 1803, most of the land for modern day Kansas was acquired by the United States from France as part of the 828,000 square mile Louisiana Purchase for 2.83 cents per acre.
In 1854, the Kansas Territory was organized, then in 1861 Kansas became the 34th U.S. state. In 1857, Washington County was established.
21st century
In 2010, the Keystone-Cushing Pipeline (Phase II) was constructed north to south through Washington County, with much controversy over tax exemption and environmental concerns (if a leak ever does occur).[4][5]
Geography
According to the U.S. Census Bureau, the county has a total area of 899 square miles (2,330 km2), of which 895 square miles (2,320 km2) is land and 3.9 square miles (10 km2) (0.4%) is water.[6]
Adjacent counties
- Jefferson County, Nebraska (north)
- Gage County, Nebraska (northeast)
- Marshall County (east)
- Riley County (southeast)
- Clay County (south)
- Cloud County (southwest)
- Republic County (west)
- Thayer County, Nebraska (northwest)
Demographics
| Historical population | |||
|---|---|---|---|
| Census | Pop. | %± | |
| 1860 | 383 | — | |
| 1870 | 4,081 | 965.5% | |
| 1880 | 14,910 | 265.4% | |
| 1890 | 22,894 | 53.5% | |
| 1900 | 21,963 | −4.1% | |
| 1910 | 20,229 | −7.9% | |
| 1920 | 17,984 | −11.1% | |
| 1930 | 17,112 | −4.8% | |
| 1940 | 15,921 | −7.0% | |
| 1950 | 12,977 | −18.5% | |
| 1960 | 10,739 | −17.2% | |
| 1970 | 9,249 | −13.9% | |
| 1980 | 8,543 | −7.6% | |
| 1990 | 7,073 | −17.2% | |
| 2000 | 6,483 | −8.3% | |
| 2010 | 5,799 | −10.6% | |
| Est. 2018 | 5,420 | [7] | −6.5% |
| U.S. Decennial Census[8] 1790-1960[9] 1900-1990[10] 1990-2000[11] 2010-2016[2] | |||

As of the census[12] of 2000, there were 6,483 people, 2,673 households, and 1,780 families residing in the county. The population density was 7 people per square mile (3/km²). There were 3,142 housing units at an average density of 4 per square mile (1/km²). The racial makeup of the county was 98.90% White, 0.11% Black or African American, 0.34% Native American, 0.05% Asian, 0.09% from other races, and 0.51% from two or more races. 0.65% of the population were Hispanic or Latino of any race.
There were 2,673 households out of which 26.60% had children under the age of 18 living with them, 59.40% were married couples living together, 4.20% had a female householder with no husband present, and 33.40% were non-families. 31.20% of all households were made up of individuals and 17.80% had someone living alone who was 65 years of age or older. The average household size was 2.35 and the average family size was 2.96.
In the county, the population was spread out with 23.70% under the age of 18, 5.40% from 18 to 24, 22.90% from 25 to 44, 23.00% from 45 to 64, and 25.10% who were 65 years of age or older. The median age was 44 years. For every 100 females there were 100.80 males. For every 100 females age 18 and over, there were 97.80 males.
The median income for a household in the county was $29,363, and the median income for a family was $37,260. Males had a median income of $25,074 versus $18,000 for females. The per capita income for the county was $15,515. About 7.30% of families and 10.10% of the population were below the poverty line, including 12.20% of those under age 18 and 12.40% of those age 65 or over.
Government
Presidential elections
| Year | Republican | Democratic | Third Parties |
|---|---|---|---|
| 2016 | 79.4% 2,194 | 14.0% 387 | 6.7% 184 |
| 2012 | 80.2% 2,316 | 18.1% 524 | 1.7% 49 |
| 2008 | 75.4% 2,248 | 22.1% 659 | 2.5% 73 |
| 2004 | 78.3% 2,498 | 20.2% 643 | 1.5% 49 |
| 2000 | 74.9% 2,446 | 21.0% 687 | 4.1% 134 |
| 1996 | 67.4% 2,397 | 22.6% 804 | 10.0% 356 |
| 1992 | 47.0% 1,740 | 24.1% 893 | 28.9% 1,069 |
| 1988 | 67.1% 2,269 | 31.5% 1,063 | 1.4% 48 |
| 1984 | 75.7% 2,979 | 22.6% 889 | 1.7% 68 |
| 1980 | 74.9% 3,058 | 19.2% 784 | 5.9% 241 |
| 1976 | 60.4% 2,543 | 37.1% 1,564 | 2.5% 106 |
| 1972 | 75.1% 3,301 | 22.7% 996 | 2.2% 97 |
| 1968 | 68.3% 3,177 | 24.3% 1,131 | 7.4% 344 |
| 1964 | 56.4% 2,654 | 42.8% 2,015 | 0.8% 36 |
| 1960 | 68.1% 3,707 | 31.3% 1,706 | 0.6% 31 |
| 1956 | 74.8% 4,220 | 24.6% 1,389 | 0.6% 32 |
| 1952 | 81.4% 5,135 | 18.2% 1,148 | 0.4% 26 |
| 1948 | 66.2% 3,894 | 32.2% 1,894 | 1.6% 95 |
| 1944 | 77.1% 5,040 | 22.3% 1,455 | 0.6% 41 |
| 1940 | 73.3% 5,792 | 26.1% 2,061 | 0.6% 50 |
| 1936 | 58.7% 4,809 | 41.0% 3,355 | 0.3% 28 |
| 1932 | 43.4% 3,324 | 55.3% 4,234 | 1.2% 95 |
| 1928 | 67.4% 4,781 | 31.9% 2,267 | 0.7% 49 |
| 1924 | 61.0% 4,120 | 22.6% 1,528 | 16.4% 1,108 |
| 1920 | 76.1% 4,390 | 22.3% 1,287 | 1.7% 95 |
| 1916 | 51.7% 3,766 | 45.5% 3,316 | 2.7% 200 |
| 1912 | 28.4% 1,326 | 41.0% 1,914 | 30.6% 1,427 |
| 1908 | 57.5% 2,711 | 40.4% 1,904 | 2.1% 99 |
| 1904 | 68.1% 3,066 | 28.0% 1,259 | 3.9% 175 |
| 1900 | 56.0% 2,960 | 42.6% 2,252 | 1.4% 72 |
| 1896 | 50.7% 2,514 | 48.2% 2,391 | 1.2% 57 |
| 1892 | 44.8% 2,323 | 55.2% 2,862 | |
| 1888 | 62.3% 2,999 | 31.4% 1,511 | 6.3% 305 |
Washington County is overwhelmingly Republican. No Democratic Presidential candidate has won Washington County since Franklin D. Roosevelt in 1932, and Roosevelt remains the solitary Democrat to ever win a majority in the county. Since 1940 only Lyndon Johnson in 1964 has reached forty percent of Washington County's vote for the Democratic Party.
Education
The county is served by:
Communities

Cities
- Barnes
- Clifton (partly in Clay County)
- Greenleaf
- Haddam
- Hanover
- Hollenberg
- Linn
- Mahaska
- Morrowville
- Palmer
- Vining (partly in Clay County)
- Washington
Unincorporated community
Townships
Washington County is divided into twenty-five townships. The city of Washington is considered governmentally independent and is excluded from the census figures for the townships. In the following table, the population center is the largest city (or cities) included in that township's population total, if it is of a significant size.
| Township | FIPS | Population center |
Population | Population density /km² (/sq mi) |
Land area km² (sq mi) | Water area km² (sq mi) | Water % | Geographic coordinates |
|---|---|---|---|---|---|---|---|---|
| Barnes | 04275 | 233 | 3 (6) | 93 (36) | 0 (0) | 0% | 39°41′59″N 96°51′41″W | |
| Brantford | 08250 | 91 | 1 (3) | 93 (36) | 0 (0) | 0% | 39°42′0″N 97°19′19″W | |
| Charleston | 12625 | 99 | 1 (3) | 93 (36) | 0 (0) | 0.03% | 39°52′36″N 96°58′54″W | |
| Clifton | 14225 | 459 | 5 (13) | 94 (36) | 0 (0) | 0% | 39°35′19″N 97°18′11″W | |
| Coleman | 14750 | 64 | 1 (2) | 94 (36) | 0 (0) | 0% | 39°46′39″N 97°11′24″W | |
| Farmington | 23275 | 192 | 2 (5) | 94 (36) | 0 (0) | 0% | 39°51′52″N 97°6′1″W | |
| Franklin | 24525 | 139 | 2 (4) | 92 (36) | 0 (0) | 0.24% | 39°57′33″N 96°59′20″W | |
| Grant | 28175 | 25 | 0 (1) | 93 (36) | 0 (0) | 0% | 39°46′24″N 97°19′21″W | |
| Greenleaf | 28650 | 450 | 5 (13) | 93 (36) | 0 (0) | 0% | 39°42′33″N 96°59′5″W | |
| Haddam | 29425 | 246 | 3 (7) | 93 (36) | 0 (0) | 0% | 39°51′51″N 97°18′28″W | |
| Hanover | 29900 | 884 | 9 (25) | 93 (36) | 0 (0) | 0.05% | 39°52′54″N 96°52′10″W | |
| Highland | 32025 | 22 | 0 (1) | 92 (36) | 0 (0) | 0.45% | 39°57′16″N 97°5′30″W | |
| Independence | 33950 | 169 | 2 (5) | 93 (36) | 0 (0) | 0.03% | 39°57′28″N 96°51′50″W | |
| Kimeo | 36850 | 75 | 1 (2) | 93 (36) | 0 (0) | 0% | 39°36′11″N 96°57′57″W | |
| Lincoln | 41250 | 84 | 1 (2) | 93 (36) | 0 (0) | 0% | 39°37′2″N 96°51′12″W | |
| Linn | 41450 | 599 | 6 (17) | 93 (36) | 0 (0) | 0.03% | 39°41′5″N 97°5′16″W | |
| Little Blue | 41500 | 93 | 1 (3) | 93 (36) | 0 (0) | 0.09% | 39°46′38″N 96°51′59″W | |
| Logan | 42300 | 109 | 1 (3) | 92 (36) | 0 (0) | 0.05% | 39°47′11″N 96°57′56″W | |
| Lowe | 43025 | 76 | 1 (2) | 92 (36) | 0 (0) | 0% | 39°57′29″N 97°12′5″W | |
| Mill Creek | 46750 | 274 | 3 (8) | 94 (36) | 0 (0) | 0% | 39°52′4″N 97°11′20″W | |
| Sheridan | 64775 | 119 | 1 (3) | 93 (36) | 0 (0) | 0% | 39°37′3″N 97°11′19″W | |
| Sherman | 65125 | 249 | 3 (7) | 93 (36) | 0 (0) | 0% | 39°37′2″N 97°6′3″W | |
| Strawberry | 68550 | 130 | 1 (4) | 94 (36) | 0 (0) | 0% | 39°41′32″N 97°12′30″W | |
| Union | 72475 | 161 | 2 (5) | 92 (36) | 0 (0) | 0.04% | 39°57′58″N 97°19′30″W | |
| Washington | 75850 | 218 | 2 (6) | 91 (35) | 0 (0) | 0.04% | 39°47′12″N 97°4′38″W |
See also
|
|
References
- https://www.census.gov/quickfacts/fact/table/washingtoncountykansas,US/PST045218
- "State & County QuickFacts". United States Census Bureau. Retrieved July 29, 2014.
- "Find a County". National Association of Counties. Retrieved 2011-06-07.
- Keystone Pipeline - Marion County Commission calls out Legislative Leadership on Pipeline Deal; April 18, 2010. Archived October 22, 2011, at the Wayback Machine
- Keystone Pipeline - TransCanada inspecting pipeline; December 10, 2010.
- "US Gazetteer files: 2010, 2000, and 1990". United States Census Bureau. 2011-02-12. Retrieved 2011-04-23.
- "Population and Housing Unit Estimates". Retrieved November 29, 2019.
- "U.S. Decennial Census". United States Census Bureau. Retrieved July 29, 2014.
- "Historical Census Browser". University of Virginia Library. Retrieved July 29, 2014.
- "Population of Counties by Decennial Census: 1900 to 1990". United States Census Bureau. Retrieved July 29, 2014.
- "Census 2000 PHC-T-4. Ranking Tables for Counties: 1990 and 2000" (PDF). United States Census Bureau. Retrieved July 29, 2014.
- "U.S. Census website". United States Census Bureau. Retrieved 2008-01-31.
- http://uselectionatlas.org/RESULTS
- "Map of Wet and Dry Counties". Alcoholic Beverage Control, Kansas Department of Revenue. November 2006. Archived from the original on 2007-10-08. Retrieved 2007-12-28.
Further reading
- 70th Anniversary Edition Supplement; Washington County Register; 88 pages; September 16, 1938.
- Plat Book of Washington County, Kansas; Brown-Scoville Publishing Co; 81 pages; 1906.
- Historical Plat Book of Washington County, Kansas; J.S. Bird; 90 pages; 1882.
External links
| Wikimedia Commons has media related to Washington County, Kansas. |
- County
- Maps
- Washington County Maps: Current, Historic, KDOT
- Kansas Highway Maps: Current, Historic, KDOT
- Kansas Railroad Maps: Current, 1996, 1915, KDOT and Kansas Historical Society
Places adjacent to Washington County, Kansas | |
|---|---|
Municipalities and communities of Washington County, Kansas, United States | ||
|---|---|---|
| Cities | Map of Kansas highlighting Washington County | |
| Unincorporated communities | ||
| Footnotes | ‡This populated place also has portions in an adjacent county or counties | |
| Authority control |
|
|---|