Rice County, Kansas
Rice County (standard abbreviation: RC) is a county located in the U.S. state of Kansas. As of the 2010 census, the county population was 10,083.[1] The largest city and county seat is Lyons.[2] The county was named in memory of Samuel Allen Rice, Brigadier-General, United States volunteers, killed April 30, 1864, at Jenkins Ferry, Arkansas.[3]
Rice County | |
|---|---|
 Grain elevator in Bushton (2004) | |
 Location within the U.S. state of Kansas | |
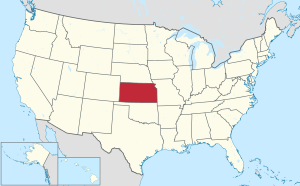 Kansas's location within the U.S. | |
| Coordinates: 38°21′N 98°12′W | |
| Country | |
| State | |
| Founded | February 26, 1867 |
| Named for | Samuel Allen Rice |
| Seat | Lyons |
| Largest city | Lyons |
| Area | |
| • Total | 728 sq mi (1,890 km2) |
| • Land | 726 sq mi (1,880 km2) |
| • Water | 1.7 sq mi (4 km2) 0.2%% |
| Population | |
| • Estimate (2018) | 9,531 |
| • Density | 14/sq mi (5/km2) |
| Time zone | UTC−6 (Central) |
| • Summer (DST) | UTC−5 (CDT) |
| Congressional district | 1st |
| Website | ricecounty.us |
History
Early history
For many millennia, the Great Plains of North America was inhabited by nomadic Native Americans. From the 16th century to 18th century, the Kingdom of France claimed ownership of large parts of North America. In 1762, after the French and Indian War, France secretly ceded New France to Spain, per the Treaty of Fontainebleau.
19th century
In 1802, Spain returned most of the land to France, but keeping title to about 7,500 square miles. In 1803, most of the land for modern day Kansas was acquired by the United States from France as part of the 828,000 square mile Louisiana Purchase for 2.83 cents per acre.
In 1854, the Kansas Territory was organized, then in 1861 Kansas became the 34th U.S. state. In 1867, Rice County was established.
The Santa Fe Trail followed the route of present-day U.S. Route 56. Ruts in the earth from the trail are still visible in several locations. (Ralph's Ruts are visible in aerial photos at 38.35959264°N 98.42225502°W.)[4]
In 1878, Atchison, Topeka and Santa Fe Railway and parties from Marion County and McPherson County chartered the Marion and McPherson Railway Company.[5] In 1879, a branch line was built from Florence to McPherson, in 1880 it was extended to Lyons, in 1881 it was extended to Ellinwood.[6] The line was leased and operated by the Atchison, Topeka and Santa Fe Railway. The line from Florence to Marion, was abandoned in 1968.[7] In 1992, the line from Marion to McPherson was sold to Central Kansas Railway. In 1993, after heavy flood damage, the line from Marion to McPherson was abandoned. The original branch line connected Florence, Marion, Canada, Hillsboro, Lehigh, Canton, Galva, McPherson, Conway, Windom, Little River, Mitchell, Lyons, Chase, Ellinwood.
 Samuel Allen Rice in 1864
 1845 Santa Fe Trail crossing Rice County
 1915-1918 Railroad Map of Rice County
Geography
According to the U.S. Census Bureau, the county has a total area of 728 square miles (1,890 km2), of which 726 square miles (1,880 km2) is land and 1.7 square miles (4.4 km2) (0.2%) is water.[8]
Adjacent counties
- Ellsworth County (north)
- McPherson County (east)
- Reno County (south)
- Stafford County (southwest)
- Barton County (northwest)
National protected area
Demographics

| Historical population | |||
|---|---|---|---|
| Census | Pop. | %± | |
| 1870 | 5 | — | |
| 1880 | 9,292 | 185,740.0% | |
| 1890 | 14,451 | 55.5% | |
| 1900 | 14,745 | 2.0% | |
| 1910 | 15,106 | 2.4% | |
| 1920 | 14,832 | −1.8% | |
| 1930 | 13,800 | −7.0% | |
| 1940 | 17,213 | 24.7% | |
| 1950 | 15,635 | −9.2% | |
| 1960 | 13,909 | −11.0% | |
| 1970 | 12,320 | −11.4% | |
| 1980 | 11,900 | −3.4% | |
| 1990 | 10,610 | −10.8% | |
| 2000 | 10,761 | 1.4% | |
| 2010 | 10,083 | −6.3% | |
| Est. 2018 | 9,531 | [9] | −5.5% |
| U.S. Decennial Census[10] 1790-1960[11] 1900-1990[12] 1990-2000[13] 2010-2016[1] | |||
As of the census[14] of 2000, there were 10,761 people, 4,050 households, and 2,830 families residing in the county. The population density was 15 people per square mile (6/km²). There were 4,609 housing units at an average density of 6 per square mile (2/km²). The racial makeup of the county was 94.68% White, 1.15% Black or African American, 0.57% Native American, 0.33% Asian, 0.04% Pacific Islander, 1.84% from other races, and 1.39% from two or more races. 5.61% of the population were Hispanic or Latino of any race.
There were 4,050 households out of which 31.20% had children under the age of 18 living with them, 59.10% were married couples living together, 7.20% had a female householder with no husband present, and 30.10% were non-families. 27.80% of all households were made up of individuals and 15.30% had someone living alone who was 65 years of age or older. The average household size was 2.44 and the average family size was 2.97.
In the county, the population was spread out with 24.70% under the age of 18, 13.30% from 18 to 24, 22.80% from 25 to 44, 21.30% from 45 to 64, and 18.00% who were 65 years of age or older. The median age was 38 years. For every 100 females there were 92.20 males. For every 100 females age 18 and over, there were 88.20 males.
The median income for a household in the county was $35,671, and the median income for a family was $40,960. Males had a median income of $31,175 versus $18,968 for females. The per capita income for the county was $16,064. About 8.50% of families and 10.70% of the population were below the poverty line, including 14.60% of those under age 18 and 8.20% of those age 65 or over.
Government
Presidential elections
| Year | Republican | Democratic | Third Parties |
|---|---|---|---|
| 2016 | 74.6% 2,837 | 18.3% 695 | 7.2% 272 |
| 2012 | 72.7% 2,676 | 24.8% 911 | 2.6% 94 |
| 2008 | 69.1% 2,780 | 28.9% 1,163 | 1.9% 78 |
| 2004 | 72.7% 3,182 | 25.8% 1,130 | 1.5% 64 |
| 2000 | 64.2% 2,903 | 31.5% 1,422 | 4.3% 195 |
| 1996 | 59.3% 2,842 | 29.9% 1,434 | 10.7% 513 |
| 1992 | 40.9% 2,158 | 29.5% 1,555 | 29.6% 1,558 |
| 1988 | 53.9% 2,503 | 43.8% 2,033 | 2.4% 109 |
| 1984 | 68.7% 3,598 | 29.8% 1,559 | 1.6% 82 |
| 1980 | 57.7% 3,211 | 33.2% 1,847 | 9.2% 510 |
| 1976 | 44.8% 2,584 | 53.0% 3,056 | 2.2% 125 |
| 1972 | 66.2% 3,843 | 31.5% 1,825 | 2.3% 135 |
| 1968 | 56.2% 3,141 | 36.7% 2,049 | 7.1% 396 |
| 1964 | 39.2% 2,390 | 60.1% 3,665 | 0.7% 43 |
| 1960 | 64.8% 4,329 | 34.9% 2,328 | 0.3% 23 |
| 1956 | 70.5% 4,638 | 29.3% 1,926 | 0.3% 17 |
| 1952 | 74.5% 5,572 | 24.5% 1,832 | 1.0% 74 |
| 1948 | 58.2% 4,002 | 40.0% 2,752 | 1.9% 128 |
| 1944 | 61.1% 4,024 | 38.1% 2,505 | 0.8% 55 |
| 1940 | 56.5% 4,792 | 42.9% 3,635 | 0.7% 56 |
| 1936 | 40.2% 3,318 | 59.5% 4,905 | 0.3% 22 |
| 1932 | 49.3% 3,107 | 48.2% 3,037 | 2.5% 154 |
| 1928 | 74.1% 4,321 | 25.1% 1,462 | 0.9% 52 |
| 1924 | 68.5% 3,920 | 22.8% 1,303 | 8.7% 497 |
| 1920 | 69.0% 3,651 | 28.9% 1,532 | 2.1% 112 |
| 1916 | 42.6% 2,494 | 47.9% 2,801 | 9.5% 557 |
| 1912 | 20.6% 697 | 38.8% 1,314 | 40.7% 1,378[lower-alpha 1] |
| 1908 | 51.4% 1,832 | 39.4% 1,407 | 9.2% 329 |
| 1904 | 64.2% 1,994 | 23.4% 727 | 12.5% 387 |
| 1900 | 54.4% 2,013 | 41.3% 1,527 | 4.3% 159 |
| 1896 | 48.8% 1,729 | 48.8% 1,731 | 2.5% 87 |
| 1892 | 46.8% 1,724 | 53.2% 1,961[lower-alpha 2] | |
| 1888 | 57.8% 1,851 | 29.2% 934 | 13.1% 418 |
Education
Unified school districts
- District Office In Neighboring County
Colleges and Universities
- Sterling College, a private four year Christian institution, is located in Sterling.
Communities

Unincorporated communities
Townships
Rice County is divided into twenty townships. The cities of Lyons and Sterling are considered governmentally independent and are excluded from the census figures for the townships. In the following table, the population center is the largest city (or cities) included in that township's population total, if it is of a significant size.
| Township | FIPS | Population center |
Population | Population density /km² (/sq mi) |
Land area km² (sq mi) | Water area km² (sq mi) | Water % | Geographic coordinates |
|---|---|---|---|---|---|---|---|---|
| Atlanta | 03075 | 233 | 3 (7) | 90 (35) | 0 (0) | 0.25% | 38°18′22″N 98°11′58″W | |
| Bell | 05375 | 18 | 0 (0) | 94 (36) | 1 (0) | 0.65% | 38°13′10″N 98°24′2″W | |
| Center | 12075 | 136 | 1 (4) | 95 (37) | 0 (0) | 0.04% | 38°17′50″N 98°18′12″W | |
| East Washington | 19725 | 179 | 2 (5) | 93 (36) | 0 (0) | 0.03% | 38°13′18″N 97°58′34″W | |
| Eureka | 21900 | 65 | 1 (2) | 95 (37) | 0 (0) | 0% | 38°29′52″N 98°19′21″W | |
| Farmer | 23100 | 441 | 5 (12) | 94 (36) | 0 (0) | 0% | 38°30′0″N 98°24′55″W | |
| Galt | 25175 | 51 | 1 (1) | 94 (36) | 0 (0) | 0.22% | 38°28′8″N 98°5′59″W | |
| Harrison | 30425 | 192 | 2 (5) | 92 (35) | 0 (0) | 0.06% | 38°23′3″N 98°11′49″W | |
| Lincoln | 41100 | 577 | 6 (16) | 95 (37) | 0 (0) | 0% | 38°22′10″N 98°19′19″W | |
| Mitchell | 47525 | 131 | 1 (4) | 94 (36) | 0 (0) | 0.18% | 38°23′24″N 98°5′42″W | |
| Odessa | 52150 | 55 | 1 (2) | 93 (36) | 0 (0) | 0.10% | 38°28′17″N 97°59′21″W | |
| Pioneer | 55925 | 101 | 1 (3) | 94 (36) | 0 (0) | 0.03% | 38°23′34″N 98°25′39″W | |
| Raymond | 58575 | 185 | 2 (5) | 92 (36) | 1 (0) | 0.71% | 38°17′38″N 98°24′56″W | |
| Rockville | 60725 | 134 | 1 (4) | 93 (36) | 0 (0) | 0.04% | 38°18′17″N 97°57′36″W | |
| Sterling | 68225 | 223 | 2 (5) | 114 (44) | 1 (0) | 1.01% | 38°12′19″N 98°11′44″W | |
| Union | 72325 | 741 | 8 (21) | 93 (36) | 0 (0) | 0% | 38°23′34″N 97°59′32″W | |
| Valley | 73100 | 276 | 4 (9) | 77 (30) | 1 (0) | 1.11% | 38°13′27″N 98°18′44″W | |
| Victoria | 73825 | 364 | 4 (10) | 94 (36) | 0 (0) | 0.06% | 38°29′57″N 98°10′24″W | |
| West Washington | 77425 | 138 | 1 (4) | 93 (36) | 0 (0) | 0.12% | 38°13′9″N 98°4′58″W | |
| Wilson | 79775 | 147 | 2 (4) | 94 (36) | 0 (0) | 0.02% | 38°18′2″N 98°6′2″W |
See also
|
|
References
- "State & County QuickFacts". United States Census Bureau. Retrieved July 28, 2014.
- "Find a County". National Association of Counties. Archived from the original on May 31, 2011. Retrieved 2011-06-07.
- "Rice County". Kansas State Library. Archived from the original on 2007-08-10. Retrieved 2007-08-13.
- "Aerial Photos Topo Maps of Santa Fe Trail Ruts and Sites". Retrieved 2007-12-28.
- Marion County Kansas : Past and Present; Sondra Van Meter; MB Publishing House; LCCN 72-92041; 344 pages; 1972.
- Fourth Annual Report of the Board of Railroad Commissioners for the Year Ending December 1, 1886 in State of Kansas; Kansas Publishing House; 1886.
- Railway Abandonment 1968
- "US Gazetteer files: 2010, 2000, and 1990". United States Census Bureau. 2011-02-12. Retrieved 2011-04-23.
- "Population and Housing Unit Estimates". Retrieved December 23, 2019.
- "U.S. Decennial Census". United States Census Bureau. Retrieved July 28, 2014.
- "Historical Census Browser". University of Virginia Library. Retrieved July 28, 2014.
- "Population of Counties by Decennial Census: 1900 to 1990". United States Census Bureau. Retrieved July 28, 2014.
- "Census 2000 PHC-T-4. Ranking Tables for Counties: 1990 and 2000" (PDF). United States Census Bureau. Retrieved July 28, 2014.
- "U.S. Census website". United States Census Bureau. Retrieved 2008-01-31.
- http://uselectionatlas.org/RESULTS
- "Map of Wet and Dry Counties". Alcoholic Beverage Control, Kansas Department of Revenue. November 2004. Archived from the original on October 8, 2007. Retrieved 2007-01-21.
- Notes
- This total comprises 1,186 votes (35.0%) for Progressive Theodore Roosevelt and 192 votes (5.7%) for Socialist Eugene V. Debs.
- This total comprises 1,821 votes (49.4%) were for Populist James B. Weaver (who was supported by the state’s Democrats) and 140 (3.8%) for Prohibition Party candidate John Bidwell.
Further reading
- County
- Standard Atlas of Rice County, Kansas; Geo. A. Ogle & Co; 75 pages; 1919.
- Plat Book of Rice County, Kansas; North West Publishing Co; 44 pages; 1902.
- Handbook of Rick County, Kansas; C.S. Burch Publishing Co; 38 pages; 1888.
- Trails
- The Story of the Marking of the Santa Fe Trail by the Daughters of the American Revolution in Kansas and the State of Kansas; Almira Cordry; Crane Co; 164 pages; 1915.
- The National Old Trails Road To Southern California, Part 1 (LA to KC); Automobile Club Of Southern California; 64 pages; 1916.
External links
| Wikimedia Commons has media related to Rice County, Kansas. |
- County
- Maps
- Rice County Maps: Current, Historic, KDOT
- Kansas Highway Maps: Current, Historic, KDOT
- Kansas Railroad Maps: Current, 1996, 1915, KDOT and Kansas Historical Society
Places adjacent to Rice County, Kansas | ||||||||||
|---|---|---|---|---|---|---|---|---|---|---|
| ||||||||||
Municipalities and communities of Rice County, Kansas, United States | ||
|---|---|---|
| Cities | Map of Kansas highlighting Rice County | |
| Unincorporated communities | ||
| Townships | ||
| Authority control |
|
|---|