Edwards County, Kansas
Edwards County (county code ED) is a county located in the U.S. states of Kansas. As of the 2010 census, the county population was 3,037,[1] Its county seat and most populous city is Kinsley.[2] The county was founded in 1874 and named for W. C. Edwards, of Hutchinson, a pioneer settler, who played an active role in its organization.[3]
Edwards County | |
|---|---|
 Watertower in Kinsely (2009) | |
 Location within the U.S. state of Kansas | |
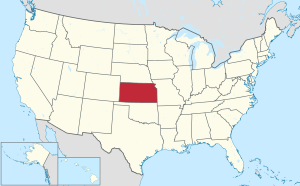 Kansas's location within the U.S. | |
| Coordinates: | |
| Country | |
| State | |
| Founded | March 18, 1874 |
| Named for | John H. Edwards |
| Seat | Kinsley |
| Largest city | Kinsley |
| Area | |
| • Total | 622 sq mi (1,610 km2) |
| • Land | 622 sq mi (1,610 km2) |
| • Water | 0.1 sq mi (0.3 km2) 0.01%% |
| Population | |
| • Estimate (2018) | 2,849 |
| • Density | 4.9/sq mi (1.9/km2) |
| Time zone | UTC−6 (Central) |
| • Summer (DST) | UTC−5 (CDT) |
| Area code | 620 |
| Congressional district | 4th |
| Website | edwardscounty.org |
Geography
According to the U.S. Census Bureau, the county has a total area of 622 square miles (1,610 km2), of which 622 square miles (1,610 km2) is land and 0.1 square miles (0.26 km2) (0.01%) is water.[4]
Geographic Features
The Arkansas River flows through Edwards County from the southwest corner to the Pawnee County line near U.S. Route 56.
Major highways
Three U.S. Routes run through Edwards County, all meeting in Kinsley. An east-west route, U.S. Route 50 circumvents Belpre and Lewis before joining with westbound U.S. Route 56 in Kinsley. The single road then passes through Offerle and west into Ford County. U.S. Route 183 runs from Kiowa County in the south to Kinsley, where it joins eastbound U.S. 56, running as a single highway to Pawnee County. K-19 starts at U.S. Route 50 near Belpre, and travels north into Pawnee County.
Adjacent counties
- Pawnee County (north)
- Stafford County (east)
- Pratt County (southeast)
- Kiowa County (south)
- Ford County (southwest)
- Hodgeman County (northwest)
Demographics
| Historical population | |||
|---|---|---|---|
| Census | Pop. | %± | |
| 1880 | 2,409 | — | |
| 1890 | 3,600 | 49.4% | |
| 1900 | 3,682 | 2.3% | |
| 1910 | 7,033 | 91.0% | |
| 1920 | 7,057 | 0.3% | |
| 1930 | 7,295 | 3.4% | |
| 1940 | 6,377 | −12.6% | |
| 1950 | 5,936 | −6.9% | |
| 1960 | 5,118 | −13.8% | |
| 1970 | 4,581 | −10.5% | |
| 1980 | 4,271 | −6.8% | |
| 1990 | 3,787 | −11.3% | |
| 2000 | 3,449 | −8.9% | |
| 2010 | 3,037 | −11.9% | |
| Est. 2018 | 2,849 | [5] | −6.2% |
| U.S. Decennial Census[6] 1790-1960[7] 1900-1990[8] 1990-2000[9] 2010-2016[1] | |||

As of the 2000 census,[10] there were 3,449 people, 1,455 households, and 955 families residing in the county. The population density was 6 people per square mile (2/km2). There were 1,754 housing units at an average density of 3 per square mile (1/km2). The racial makeup of the county was 92.52% White, 0.32% Black or African American, 0.49% Native American, 0.32% Asian, 5.57% from other races, and 0.78% from two or more races. Hispanic or Latino of any race were 9.71% of the population.
There were 1,455 households, out of which 28.70% had children under the age of 18 living with them, 56.30% were married couples living together, 6.00% had a female householder with no husband present, and 34.30% were non-families. 32.00% of all households were made up of individuals, and 17.30% had someone living alone who was 65 years of age or older. The average household size was 2.33 and the average family size was 2.94.
In the county, the population was spread out, with 24.60% under the age of 18, 6.70% from 18 to 24, 25.10% from 25 to 44, 22.80% from 45 to 64, and 20.80% who were 65 years of age or older. The median age was 41 years. For every 100 females there were 97.50 males. For every 100 females age 18 and over, there were 95.80 males.
The median income for a household in the county was $30,530, and the median income for a family was $38,250. Males had a median income of $27,050 versus $20,132 for females. The per capita income for the county was $17,586. About 7.00% of families and 10.40% of the population were below the poverty line, including 14.40% of those under age 18 and 8.00% of those age 65 or over.
Government
Presidential elections
| Year | Republican | Democratic | Third Parties |
|---|---|---|---|
| 2016 | 78.6% 1,037 | 16.1% 212 | 5.3% 70 |
| 2012 | 76.5% 1,059 | 21.5% 298 | 2.0% 28 |
| 2008 | 73.3% 995 | 24.5% 333 | 2.1% 29 |
| 2004 | 72.5% 1,084 | 25.8% 386 | 1.7% 26 |
| 2000 | 68.0% 1,062 | 28.6% 447 | 3.5% 54 |
| 1996 | 59.9% 1,088 | 29.7% 539 | 10.4% 188 |
| 1992 | 40.0% 769 | 29.5% 567 | 30.6% 589 |
| 1988 | 53.9% 993 | 43.0% 792 | 3.2% 58 |
| 1984 | 67.5% 1,352 | 30.3% 606 | 2.2% 44 |
| 1980 | 63.9% 1,409 | 28.0% 616 | 8.1% 179 |
| 1976 | 42.5% 1,001 | 55.3% 1,304 | 2.2% 52 |
| 1972 | 64.5% 1,534 | 31.9% 757 | 3.6% 86 |
| 1968 | 54.9% 1,243 | 36.8% 832 | 8.4% 189 |
| 1964 | 39.2% 932 | 60.0% 1,427 | 0.8% 18 |
| 1960 | 61.5% 1,588 | 38.2% 986 | 0.4% 10 |
| 1956 | 69.9% 1,816 | 29.7% 771 | 0.4% 10 |
| 1952 | 76.4% 2,192 | 22.6% 647 | 1.1% 30 |
| 1948 | 58.2% 1,627 | 38.7% 1,083 | 3.2% 88 |
| 1944 | 65.1% 1,669 | 34.2% 876 | 0.7% 19 |
| 1940 | 60.1% 1,886 | 38.9% 1,219 | 1.0% 31 |
| 1936 | 41.2% 1,394 | 58.7% 1,986 | 0.1% 3 |
| 1932 | 44.4% 1,420 | 52.9% 1,693 | 2.7% 85 |
| 1928 | 73.4% 2,171 | 26.0% 768 | 0.7% 20 |
| 1924 | 67.0% 1,929 | 19.0% 548 | 14.0% 403 |
| 1920 | 70.2% 1,782 | 26.8% 681 | 3.0% 77 |
| 1916 | 40.8% 1,158 | 50.4% 1,431 | 8.8% 249 |
| 1912 | 16.1% 276 | 44.4% 764 | 39.5% 680 |
| 1908 | 50.2% 773 | 45.7% 704 | 4.0% 62 |
| 1904 | 64.3% 816 | 25.9% 328 | 9.9% 125 |
| 1900 | 50.1% 523 | 48.1% 502 | 1.8% 19 |
| 1896 | 39.9% 322 | 59.3% 479 | 0.9% 7 |
| 1892 | 45.6% 399 | 54.4% 477 | |
| 1888 | 53.6% 541 | 33.1% 334 | 13.3% 134 |
Education
Unified school districts
Communities

Unincorporated communities
Townships
Edwards County is divided into ten townships. The city of Kinsley is considered governmentally independent and is excluded from the census figures for the townships. In the following table, the population center is the largest city (or cities) included in that township's population total, if it is of a significant size.
| Township | FIPS | Population center |
Population | Population density /km2 (/sq mi) |
Land area km2 (sq mi) | Water area km2 (sq mi) | Water % | Geographic coordinates |
|---|---|---|---|---|---|---|---|---|
| Belpre | 05850 | 186 | 1 (3) | 140 (54) | 0 (0) | 0.01% | 37°57′14″N 99°6′12″W | |
| Franklin | 24350 | 93 | 0 (1) | 191 (74) | 0 (0) | 0% | 37°48′55″N 99°11′12″W | |
| Jackson | 34750 | 98 | 1 (1) | 187 (72) | 0 (0) | 0.05% | 37°59′35″N 99°30′18″W | |
| Kinsley | 37100 | 160 | 1 (3) | 121 (47) | 0 (0) | 0.01% | 37°56′27″N 99°24′0″W | |
| Lincoln | 40650 | 143 | 1 (2) | 193 (74) | 0 (0) | 0% | 37°49′17″N 99°4′39″W | |
| Logan | 41875 | 42 | 0 (1) | 93 (36) | 0 (0) | 0% | 38°3′5″N 99°23′47″W | |
| North Brown | 51100 | 67 | 0 (1) | 163 (63) | 0 (0) | 0.05% | 37°51′43″N 99°21′34″W | |
| South Brown | 66550 | 90 | 0 (1) | 251 (97) | 0 (0) | 0% | 37°47′5″N 99°22′5″W | |
| Trenton | 71400 | 306 | 2 (6) | 136 (53) | 0 (0) | 0% | 37°52′50″N 99°32′31″W | |
| Wayne | 76125 | 606 | 5 (12) | 132 (51) | 0 (0) | 0% | 37°56′28″N 99°15′30″W | |
| Sources: "Census 2000 U.S. Gazetteer Files". U.S. Census Bureau, Geography Division. Archived from the original on 2002-08-02. | ||||||||
See also
|
|
References
- "State & County QuickFacts". United States Census Bureau. Archived from the original on August 6, 2011. Retrieved July 24, 2014.
- "Find a County". National Association of Counties. Archived from the original on 2012-07-12. Retrieved 2011-06-07.
- Gannett, Henry (1905). The Origin of Certain Place Names in the United States. Govt. Print. Off. pp. 115.
- "US Gazetteer files: 2010, 2000, and 1990". United States Census Bureau. 2011-02-12. Retrieved 2011-04-23.
- "Population and Housing Unit Estimates". Retrieved December 23, 2019.
- "U.S. Decennial Census". United States Census Bureau. Retrieved July 24, 2014.
- "Historical Census Browser". University of Virginia Library. Retrieved July 24, 2014.
- "Population of Counties by Decennial Census: 1900 to 1990". United States Census Bureau. Retrieved July 24, 2014.
- "Census 2000 PHC-T-4. Ranking Tables for Counties: 1990 and 2000" (PDF). United States Census Bureau. Retrieved July 24, 2014.
- "U.S. Census website". United States Census Bureau. Retrieved 2008-01-31.
- http://uselectionatlas.org/RESULTS
- "Map of Wet and Dry Counties". Alcoholic Beverage Control, Kansas Department of Revenue. November 2006. Archived from the original on 2007-10-08. Retrieved 2007-12-28.
Further reading
- Standard Atlas of Edwards County, Kansas; Geo. A. Ogle & Co; 40 pages; 1906.
External links
| Wikimedia Commons has media related to Edwards County, Kansas. |
- County
- Maps
- Edwards County Maps: Current, Historic, KDOT
- Kansas Highway Maps: Current, Historic, KDOT
- Kansas Railroad Maps: Current, 1996, 1915, KDOT and Kansas Historical Society
Places adjacent to Edwards County, Kansas | ||||||||||
|---|---|---|---|---|---|---|---|---|---|---|
| ||||||||||
Municipalities and communities of Edwards County, Kansas, United States | ||
|---|---|---|
| Cities | Map of Kansas highlighting Edwards County | |
| Unincorporated communities | ||
| Townships | ||
| Authority control |
|
|---|