Meade County, Kansas
Meade County (standard abbreviation: ME) is a county located in the U.S. state of Kansas. As of the 2010 census, the county population was 4,575.[1] The largest city and county seat is Meade.[2] The county was created in 1873 and named in honor of General George G. Meade.[3]
Meade County | |
|---|---|
 | |
 Location within the U.S. state of Kansas | |
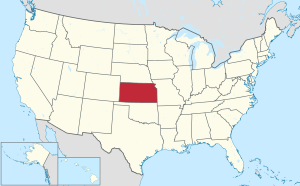 Kansas's location within the U.S. | |
| Coordinates: 37°14′00″N 100°22′01″W | |
| Country | |
| State | |
| Founded | March 20, 1873 |
| Named for | George G. Meade |
| Seat | Meade |
| Largest city | Meade |
| Area | |
| • Total | 979 sq mi (2,540 km2) |
| • Land | 978 sq mi (2,530 km2) |
| • Water | 1.3 sq mi (3 km2) 0.1%% |
| Population | |
| • Estimate (2018) | 4,146 |
| • Density | 4.7/sq mi (1.8/km2) |
| Time zone | UTC−6 (Central) |
| • Summer (DST) | UTC−5 (CDT) |
| Congressional district | 1st |
| Website | MeadeCo.org |
Geography
According to the U.S. Census Bureau, the county has a total area of 979 square miles (2,540 km2), of which 978 square miles (2,530 km2) is land and 1.3 square miles (3.4 km2) (0.1%) is water.[4]
Adjacent counties
- Gray County (north)
- Ford County (northeast)
- Clark County (east)
- Beaver County, Oklahoma (south)
- Seward County (west)
- Haskell County (northwest)
Demographics
| Historical population | |||
|---|---|---|---|
| Census | Pop. | %± | |
| 1880 | 296 | — | |
| 1890 | 2,542 | 758.8% | |
| 1900 | 1,581 | −37.8% | |
| 1910 | 5,055 | 219.7% | |
| 1920 | 5,542 | 9.6% | |
| 1930 | 6,858 | 23.7% | |
| 1940 | 5,522 | −19.5% | |
| 1950 | 5,710 | 3.4% | |
| 1960 | 5,505 | −3.6% | |
| 1970 | 4,912 | −10.8% | |
| 1980 | 4,788 | −2.5% | |
| 1990 | 4,247 | −11.3% | |
| 2000 | 4,631 | 9.0% | |
| 2010 | 4,575 | −1.2% | |
| Est. 2018 | 4,146 | [5] | −9.4% |
| U.S. Decennial Census[6] 1790-1960[7] 1900-1990[8] 1990-2000[9] 2010-2016[1] | |||

As of the census[10] of 2000, there were 4,631 people, 1,728 households, and 1,252 families residing in the county. The population density was 5 people per square mile (2/km²). There were 1,968 housing units at an average density of 2 per square mile (1/km²). The racial makeup of the county was 91.10% White, 0.39% Black or African American, 0.54% Native American, 0.22% Asian, 6.24% from other races, and 1.51% from two or more races. 10.90% of the population were Hispanic or Latino of any race.
There were 1,728 households out of which 36.40% had children under the age of 18 living with them, 64.70% were married couples living together, 4.90% had a female householder with no husband present, and 27.50% were non-families. 25.60% of all households were made up of individuals and 13.60% had someone living alone who was 65 years of age or older. The average household size was 2.61 and the average family size was 3.16.
In the county, the population was spread out with 29.50% under the age of 18, 6.90% from 18 to 24, 26.50% from 25 to 44, 19.20% from 45 to 64, and 17.90% who were 65 years of age or older. The median age was 36 years. For every 100 females there were 98.20 males. For every 100 females age 18 and over, there were 95.00 males.
The median income for a household in the county was $36,761, and the median income for a family was $41,550. Males had a median income of $29,295 versus $20,153 for females. The per capita income for the county was $16,824. About 6.70% of families and 9.30% of the population were below the poverty line, including 11.90% of those under age 18 and 5.70% of those age 65 or over.
Government
Meade County is often carried by Republican Candidates. The last time a democratic candidate has carried this county was in 1936 by Franklin D. Roosevelt.
Presidential elections
| Year | Republican | Democratic | Third Parties |
|---|---|---|---|
| 2016 | 81.7% 1,415 | 12.1% 210 | 6.2% 107 |
| 2012 | 83.6% 1,428 | 15.1% 258 | 1.4% 23 |
| 2008 | 79.8% 1,540 | 18.5% 357 | 1.8% 34 |
| 2004 | 82.4% 1,748 | 16.8% 356 | 0.8% 17 |
| 2000 | 78.1% 1,604 | 19.5% 400 | 2.4% 49 |
| 1996 | 70.1% 1,443 | 20.7% 426 | 9.2% 190 |
| 1992 | 52.5% 1,135 | 19.9% 430 | 27.7% 599 |
| 1988 | 65.2% 1,322 | 32.7% 664 | 2.1% 42 |
| 1984 | 77.2% 1,804 | 21.0% 491 | 1.8% 43 |
| 1980 | 71.7% 1,618 | 21.4% 482 | 7.0% 158 |
| 1976 | 51.5% 1,109 | 45.7% 983 | 2.8% 60 |
| 1972 | 74.6% 1,712 | 22.9% 526 | 2.5% 58 |
| 1968 | 66.2% 1,511 | 25.1% 572 | 8.7% 198 |
| 1964 | 51.8% 1,290 | 47.3% 1,179 | 0.9% 23 |
| 1960 | 70.5% 1,826 | 29.1% 754 | 0.4% 11 |
| 1956 | 74.3% 1,720 | 24.8% 575 | 0.9% 20 |
| 1952 | 76.9% 2,061 | 21.2% 568 | 1.9% 51 |
| 1948 | 60.2% 1,406 | 35.7% 834 | 4.1% 96 |
| 1944 | 68.2% 1,424 | 30.2% 631 | 1.5% 32 |
| 1940 | 61.1% 1,618 | 36.7% 970 | 2.2% 59 |
| 1936 | 46.6% 1,218 | 53.3% 1,394 | 0.1% 3 |
| 1932 | 49.5% 1,248 | 48.8% 1,231 | 1.7% 42 |
| 1928 | 73.2% 1,709 | 26.5% 618 | 0.4% 9 |
| 1924 | 66.9% 1,290 | 24.5% 472 | 8.6% 165 |
| 1920 | 71.0% 1,236 | 27.7% 483 | 1.3% 23 |
| 1916 | 45.0% 973 | 45.2% 977 | 9.9% 214 |
| 1912 | 18.3% 204 | 34.3% 383 | 47.5% 530[lower-alpha 1] |
| 1908 | 56.2% 560 | 38.8% 386 | 5.0% 50 |
| 1904 | 66.4% 383 | 28.8% 166 | 4.9% 28 |
| 1900 | 53.2% 238 | 46.8% 209 | 0.0% 0 |
| 1896 | 50.5% 203 | 48.5% 195 | 1.0% 4 |
| 1892 | 54.8% 261 | 45.2% 215 | |
| 1888 | 56.8% 578 | 33.6% 342 | 9.6% 98 |
Education
Unified school districts
Communities

Unincorporated community
Townships
Meade County is divided into nine townships. None of the cities within the county are considered governmentally independent, and all figures for the townships include those of the cities. In the following table, the population center is the largest city (or cities) included in that township's population total, if it is of a significant size.
| Township | FIPS | Population center |
Population | Population density /km² (/sq mi) |
Land area km² (sq mi) | Water area km² (sq mi) | Water % | Geographic coordinates |
|---|---|---|---|---|---|---|---|---|
| Cimarron | 13325 | 93 | 0 (1) | 303 (117) | 2 (1) | 0.57% | 37°4′34″N 100°30′42″W | |
| Crooked Creek | 16450 | 92 | 1 (2) | 141 (54) | 0 (0) | 0.06% | 37°24′41″N 100°19′30″W | |
| Fowler | 24200 | 749 | 3 (7) | 271 (105) | 0 (0) | 0.01% | 37°23′8″N 100°11′46″W | |
| Logan | 42000 | 100 | 0 (1) | 284 (110) | 0 (0) | 0.01% | 37°14′30″N 100°11′58″W | |
| Meade Center | 45350 | 1,968 | 7 (18) | 280 (108) | 0 (0) | 0.14% | 37°16′15″N 100°20′15″W | |
| Mertilla | 46025 | 221 | 1 (1) | 389 (150) | 0 (0) | 0.02% | 37°24′33″N 100°30′58″W | |
| Odee | 52075 | 50 | 0 (1) | 246 (95) | 0 (0) | 0.13% | 37°2′47″N 100°22′14″W | |
| Sand Creek | 62925 | 38 | 0 (0) | 272 (105) | 0 (0) | 0.03% | 37°3′59″N 100°9′46″W | |
| West Plains | 77300 | 1,320 | 4 (10) | 348 (134) | 0 (0) | 0.13% | 37°14′59″N 100°33′45″W |
See also
- Dry counties
- National Register of Historic Places listings in Meade County, Kansas
|
|
References
- "State & County QuickFacts". United States Census Bureau. Archived from the original on August 6, 2011. Retrieved July 27, 2014.
- "Find a County". National Association of Counties. Retrieved 2011-06-07.
- Blackmar, Frank Wilson (1912). Kansas: A Cyclopedia of State History, Volume 2. Standard Publishing Company. p. 249.
- "US Gazetteer files: 2010, 2000, and 1990". United States Census Bureau. 2011-02-12. Retrieved 2011-04-23.
- "Population and Housing Unit Estimates". Retrieved December 23, 2019.
- "U.S. Decennial Census". United States Census Bureau. Retrieved July 27, 2014.
- "Historical Census Browser". University of Virginia Library. Retrieved July 27, 2014.
- "Population of Counties by Decennial Census: 1900 to 1990". United States Census Bureau. Retrieved July 27, 2014.
- "Census 2000 PHC-T-4. Ranking Tables for Counties: 1990 and 2000" (PDF). United States Census Bureau. Retrieved July 27, 2014.
- "U.S. Census website". United States Census Bureau. Retrieved 2008-01-31.
- http://uselectionatlas.org/RESULTS
- "Map of Wet and Dry Counties". Alcoholic Beverage Control, Kansas Department of Revenue. November 2004. Archived from the original on 2007-10-08. Retrieved 2007-01-21.
- Notes
- This total comprises 418 votes (37.42 percent) for Progressive Theodore Roosevelt (who carried the county), 110 votes (10.03 percent) for Socialist Eugene V. Debs, and 2 votes for write-in candidates.
Further reading
- A History of Meade County, Kansas; Frank Sullivan; 184 pages; 1916.
- Plat Book of Meade County, Kansas; R. P. Ice Co; 43 pages; 1909.
External links
| Wikimedia Commons has media related to Meade County, Kansas. |
- County
- General county information
- Maps
- Meade County Maps: Current, Historic, KDOT
- Kansas Highway Maps: Current, Historic, KDOT
- Kansas Railroad Maps: Current, 1996, 1915, KDOT and Kansas Historical Society
Places adjacent to Meade County, Kansas | |
|---|---|
Municipalities and communities of Meade County, Kansas, United States | ||
|---|---|---|
| Cities | Map of Kansas highlighting Meade County | |
| Unincorporated community | ||
| Authority control |
|
|---|