Sumner County, Kansas
Sumner County (standard abbreviation: SU) is a county located in the U.S. state of Kansas. As of the 2010 census, the population was 24,132.[1] Its county seat is Wellington.[2]
Sumner County | |
|---|---|
 Old Oxford Mill in Oxford (2012) | |
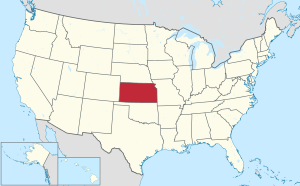
 Location within the U.S. state of Kansas | |
 Kansas's location within the U.S. | |
| Coordinates: 37°14′00″N 97°29′00″W | |
| Country | |
| State | |
| Founded | December 20, 1870 |
| Named for | Charles Sumner |
| Seat | Wellington |
| Largest city | Wellington |
| Area | |
| • Total | 1,185 sq mi (3,070 km2) |
| • Land | 1,182 sq mi (3,060 km2) |
| • Water | 3.0 sq mi (8 km2) 0.3% |
| Population (2010) | |
| • Total | 24,132 |
| • Estimate (2018) | 22,996 |
| • Density | 20/sq mi (7.9/km2) |
| Time zone | UTC−6 (Central) |
| • Summer (DST) | UTC−5 (CDT) |
| Congressional district | 4th |
| Website | County website |
History

Early history
For many millennia, the Great Plains of North America was inhabited by nomadic Native Americans. From the 16th century to 18th century, the Kingdom of France claimed ownership of large parts of North America. In 1762, after the French and Indian War, France secretly ceded New France to Spain, per the Treaty of Fontainebleau. In 1802, Spain returned most of the land to France, but keeping title to about 7,500 square miles.
In 1803, most of the land for modern day Kansas was acquired by the United States from France as part of the 828,000 square mile Louisiana Purchase for 2.83 cents per acre. In 1848, after the Mexican–American War, the Treaty of Guadalupe Hidalgo with Spain brought into the United States all or part of land for ten future states, including southwest Kansas. In 1854, the Kansas Territory was organized, then in 1861 Kansas became the 34th U.S. state.
19th century
On February 26, 1867, Sumner County was created from parts of Marion County and Butler County. It was named in honor of Charles Sumner, a U.S. Senator from Massachusetts (1811–74), who was a strong advocate of Kansas becoming a free state.
In 1887, the Chicago, Kansas and Nebraska Railway built a branch line north-south from Herington to Caldwell.[3] This branch line connected Herington, Lost Springs, Lincolnville, Antelope, Marion, Aulne, Peabody, Elbing, Whitewater, Furley, Kechi, Wichita, Peck, Corbin, Wellington, Caldwell. By 1893, this branch line was incrementally built to Fort Worth, Texas. This line is called the "OKT". The Chicago, Kansas and Nebraska Railway was foreclosed in 1891 and was taken over by Chicago, Rock Island and Pacific Railway, which shut down in 1980 and reorganized as Oklahoma, Kansas and Texas Railroad, merged in 1988 with Missouri Pacific Railroad, and finally merged in 1997 with Union Pacific Railroad. Most locals still refer to this railroad as the "Rock Island".
21st century
In December 2011, the Kansas Star Casino opened approximately 4.5 miles (7.2 km) west of the center of Mulvane, adjacent to an exit on the Kansas Turnpike that was added in the mid 1980s. The casino is located a couple blocks west of the turnpike exit.[4]
Geography
According to the U.S. Census Bureau, the county has a total area of 1,185 square miles (3,070 km2), of which 1,182 square miles (3,060 km2) is land and 3.0 square miles (7.8 km2) (0.3%) is water.[5]
Adjacent counties
- Sedgwick County (north)
- Butler County (northeast)
- Cowley County (east)
- Kay County, Oklahoma (southeast)
- Grant County, Oklahoma (southwest)
- Harper County (west)
- Kingman County (northwest)
Demographics
| Historical population | |||
|---|---|---|---|
| Census | Pop. | %± | |
| 1870 | 22 | — | |
| 1880 | 20,812 | 94,500.0% | |
| 1890 | 30,271 | 45.4% | |
| 1900 | 25,631 | −15.3% | |
| 1910 | 30,654 | 19.6% | |
| 1920 | 29,213 | −4.7% | |
| 1930 | 28,960 | −0.9% | |
| 1940 | 26,163 | −9.7% | |
| 1950 | 23,646 | −9.6% | |
| 1960 | 25,316 | 7.1% | |
| 1970 | 23,553 | −7.0% | |
| 1980 | 24,928 | 5.8% | |
| 1990 | 25,841 | 3.7% | |
| 2000 | 25,946 | 0.4% | |
| 2010 | 24,132 | −7.0% | |
| Est. 2018 | 22,996 | [6] | −4.7% |
| U.S. Decennial Census[7] 1790-1960[8] 1900-1990[9] 1990-2000[10] 2010-2016[1] | |||

Sumner County is part of the Wichita, KS Metropolitan Statistical Area.
As of the census[11] of 2000, there were 25,946 people, 9,888 households, and 7,089 families residing in the county. The population density was 22 people per square mile (8/km²). There were 10,877 housing units at an average density of 9 per square mile (4/km²). The racial makeup of the county was 94.62% White, 0.71% Black or African American, 1.05% Native American, 0.22% Asian, 0.05% Pacific Islander, 1.29% from other races, and 2.06% from two or more races. 3.58% of the population were Hispanic or Latino of any race.
There were 9,888 households out of which 34.50% had children under the age of 18 living with them, 59.90% were married couples living together, 8.00% had a female householder with no husband present, and 28.30% were non-families. 25.60% of all households were made up of individuals and 12.40% had someone living alone who was 65 years of age or older. The average household size was 2.58 and the average family size was 3.10.
In the county, the population was spread out with 28.50% under the age of 18, 7.50% from 18 to 24, 26.20% from 25 to 44, 22.40% from 45 to 64, and 15.50% who were 65 years of age or older. The median age was 38 years. For every 100 females, there were 96.80 males. For every 100 females age 18 and over, there were 93.90 males.
The median income for a household in the county was $39,415, and the median income for a family was $46,739. Males had a median income of $36,616 versus $23,020 for females. The per capita income for the county was $18,305. About 7.20% of families and 9.50% of the population were below the poverty line, including 11.20% of those under age 18 and 6.80% of those age 65 or over.
Government
Sumner County; as like many neighbouring counties, often votes for the Republican Party in Presidential elections. However, in 1992 they voted for George H.W Bush by a margin of less than two percent. The other candidate being Ross Perot. The last time they have voted for a Democratic candidate was in 1976 by Jimmy Carter.
Presidential elections
Sumner County is a Republican Stronghold. The Last democrat to carry this county was Jimmy Carter in 1976.
| Year | Republican | Democratic | Third Parties |
|---|---|---|---|
| 2016 | 71.8% 6,984 | 21.4% 2,076 | 6.8% 662 |
| 2012 | 68.5% 6,260 | 29.1% 2,658 | 2.4% 223 |
| 2008 | 65.2% 6,737 | 32.4% 3,353 | 2.4% 247 |
| 2004 | 67.6% 7,092 | 30.7% 3,217 | 1.7% 179 |
| 2000 | 60.4% 6,176 | 34.7% 3,549 | 5.0% 507 |
| 1996 | 54.2% 5,952 | 33.1% 3,638 | 12.6% 1,387 |
| 1992 | 35.3% 4,087 | 30.8% 3,564 | 34.0% 3,937 |
| 1988 | 53.7% 5,394 | 44.0% 4,417 | 2.3% 231 |
| 1984 | 64.3% 6,942 | 34.4% 3,708 | 1.3% 143 |
| 1980 | 57.5% 6,038 | 35.8% 3,761 | 6.6% 697 |
| 1976 | 44.9% 4,645 | 52.1% 5,385 | 3.0% 310 |
| 1972 | 68.1% 6,941 | 26.3% 2,685 | 5.6% 569 |
| 1968 | 54.5% 5,622 | 34.5% 3,562 | 11.0% 1,136 |
| 1964 | 45.6% 4,760 | 53.3% 5,574 | 1.1% 116 |
| 1960 | 61.5% 7,219 | 38.0% 4,462 | 0.5% 55 |
| 1956 | 63.0% 7,024 | 36.6% 4,088 | 0.4% 46 |
| 1952 | 69.0% 8,134 | 30.2% 3,567 | 0.8% 96 |
| 1948 | 55.4% 5,922 | 42.8% 4,571 | 1.8% 192 |
| 1944 | 59.9% 6,343 | 39.5% 4,187 | 0.6% 64 |
| 1940 | 51.9% 6,585 | 47.2% 5,988 | 1.0% 125 |
| 1936 | 38.2% 4,946 | 61.6% 7,966 | 0.2% 27 |
| 1932 | 42.4% 4,926 | 54.7% 6,353 | 2.9% 340 |
| 1928 | 79.6% 8,951 | 18.8% 2,108 | 1.6% 181 |
| 1924 | 54.9% 5,552 | 25.3% 2,556 | 19.8% 2,000 |
| 1920 | 60.5% 5,830 | 35.8% 3,454 | 3.7% 354 |
| 1916 | 39.4% 4,079 | 53.3% 5,519 | 7.4% 763 |
| 1912 | 12.2% 781 | 40.0% 2,557 | 47.8% 3,060[lower-alpha 1] |
| 1908 | 51.3% 3,235 | 44.0% 2,772 | 4.8% 299 |
| 1904 | 61.6% 3,264 | 28.1% 1,489 | 10.3% 545 |
| 1900 | 50.6% 3,184 | 47.4% 2,982 | 2.0% 125 |
| 1896 | 44.8% 2,515 | 54.2% 3,048 | 1.0% 56 |
| 1892 | 45.5% 3,503 | 54.5% 4,192 | |
| 1888 | 49.7% 3,499 | 30.4% 2,139 | 19.9% 1,400 |
Education
Communities

Cities
- Argonia
- Belle Plaine
- Caldwell
- Conway Springs
- Geuda Springs (partly in Cowley County)
- Hunnewell
- Mayfield
- Milan
- Mulvane (partly in Sedgwick County)
- Oxford
- South Haven
- Wellington
Unincorporated communities
Ghost towns
- Bushnell
- Cleardale
- Doster
- Ewell
- Metcalf
- Roland
- Sumner City
Townships
Sumner County is divided into thirty townships. The cities of Caldwell and Wellington are considered governmentally independent and are excluded from the census figures for the townships. In the following table, the population center is the largest city (or cities) included in that township's population total, if it is of a significant size.
| Township | FIPS | Population center |
Population | Population density /km² (/sq mi) |
Land area km² (sq mi) | Water area km² (sq mi) | Water % | Geographic coordinates |
|---|---|---|---|---|---|---|---|---|
| Avon | 03575 | 319 | 3 (9) | 93 (36) | 0 (0) | 0.03% | 37°15′58″N 97°18′56″W | |
| Belle Plaine | 05525 | 3,504 | 33 (87) | 105 (40) | 1 (0) | 0.69% | 37°24′33″N 97°17′19″W | |
| Bluff | 07750 | 74 | 1 (1) | 136 (53) | 0 (0) | 0% | 37°3′19″N 97°44′18″W | |
| Caldwell | 09925 | 200 | 1 (4) | 136 (52) | 0 (0) | 0.02% | 37°3′42″N 97°37′52″W | |
| Chikaskia | 13150 | 69 | 1 (2) | 94 (36) | 0 (0) | 0.02% | 37°10′4″N 97°38′4″W | |
| Conway | 15300 | 1,286 | 14 (35) | 94 (36) | 0 (0) | 0% | 37°24′33″N 97°39′4″W | |
| Creek | 16300 | 241 | 3 (7) | 95 (37) | 0 (0) | 0.05% | 37°20′10″N 97°44′18″W | |
| Dixon | 18200 | 738 | 8 (20) | 94 (36) | 0 (0) | 0% | 37°15′55″N 97°45′44″W | |
| Downs | 18525 | 159 | 2 (5) | 91 (35) | 0 (0) | 0% | 37°10′43″N 97°31′12″W | |
| Eden | 19800 | 452 | 5 (12) | 95 (37) | 0 (0) | 0% | 37°25′45″N 97°45′36″W | |
| Falls | 22875 | 187 | 1 (3) | 139 (54) | 0 (0) | 0% | 37°4′48″N 97°31′52″W | |
| Gore | 26975 | 2,220 | 27 (70) | 83 (32) | 1 (1) | 1.69% | 37°26′56″N 97°12′28″W | |
| Greene | 28525 | 80 | 1 (2) | 93 (36) | 0 (0) | 0.10% | 37°10′28″N 97°18′26″W | |
| Guelph | 29175 | 164 | 1 (3) | 141 (55) | 0 (0) | 0% | 37°4′10″N 97°19′21″W | |
| Harmon | 30125 | 277 | 3 (9) | 79 (31) | 0 (0) | 0% | 37°21′31″N 97°19′6″W | |
| Illinois | 33800 | 178 | 2 (5) | 94 (36) | 0 (0) | 0.05% | 37°25′20″N 97°31′6″W | |
| Jackson | 34925 | 153 | 2 (4) | 94 (36) | 0 (0) | 0.02% | 37°10′36″N 97°24′38″W | |
| London | 42400 | 774 | 7 (19) | 107 (41) | 1 (0) | 0.93% | 37°26′4″N 97°24′32″W | |
| Morris | 48375 | 35 | 0 (1) | 94 (36) | 0 (0) | 0% | 37°10′35″N 97°44′17″W | |
| Osborne | 53335 | 273 | 3 (8) | 92 (35) | 1 (0) | 1.30% | 37°15′11″N 97°32′9″W | |
| Oxford | 53875 | 1,403 | 14 (37) | 99 (38) | 1 (0) | 1.08% | 37°16′29″N 97°10′31″W | |
| Palestine | 54175 | 249 | 3 (9) | 72 (28) | 1 (0) | 1.26% | 37°21′7″N 97°13′5″W | |
| Ryan | 61950 | 239 | 3 (7) | 92 (36) | 0 (0) | 0% | 37°15′37″N 97°38′51″W | |
| Seventy-Six | 64000 | 238 | 3 (7) | 93 (36) | 0 (0) | 0% | 37°21′15″N 97°24′40″W | |
| South Haven | 66675 | 670 | 5 (12) | 140 (54) | 0 (0) | 0% | 37°2′44″N 97°24′51″W | |
| Springdale | 67575 | 761 | 8 (21) | 93 (36) | 0 (0) | 0% | 37°21′57″N 97°38′54″W | |
| Sumner | 69225 | 150 | 2 (4) | 94 (36) | 0 (0) | 0% | 37°21′8″N 97°31′12″W | |
| Valverde | 73350 | 147 | 2 (4) | 93 (36) | 1 (0) | 0.76% | 37°11′5″N 97°12′13″W | |
| Walton | 75300 | 431 | 3 (8) | 139 (54) | 0 (0) | 0% | 37°4′43″N 97°11′36″W | |
| Wellington | 76500 | 344 | 4 (11) | 81 (31) | 0 (0) | 0.06% | 37°16′17″N 97°25′16″W |
See also
|
|
References
- "State & County QuickFacts". United States Census Bureau. Retrieved July 29, 2014.
- "Find a County". National Association of Counties. Retrieved 2011-06-07.
- Rock Island Rail History
- Kansas Star Casino Plans To Open; The Wichita Eagle; December 7, 2011.
- "US Gazetteer files: 2010, 2000, and 1990". United States Census Bureau. 2011-02-12. Retrieved 2011-04-23.
- "Population and Housing Unit Estimates". Retrieved November 29, 2019.
- "U.S. Decennial Census". United States Census Bureau. Retrieved July 29, 2014.
- "Historical Census Browser". University of Virginia Library. Retrieved July 29, 2014.
- "Population of Counties by Decennial Census: 1900 to 1990". United States Census Bureau. Retrieved July 29, 2014.
- "Census 2000 PHC-T-4. Ranking Tables for Counties: 1990 and 2000" (PDF). United States Census Bureau. Retrieved July 29, 2014.
- "U.S. Census website". United States Census Bureau. Retrieved 2008-01-31.
- http://uselectionatlas.org/RESULTS
- "Map of Wet and Dry Counties". Alcoholic Beverage Control, Kansas Department of Revenue. November 2006. Archived from the original on 2007-10-08. Retrieved 2007-12-26.
- Notes
- This total comprises 2,615 votes (40.87 percent) for Progressive Theodore Roosevelt (who carried the county) and 445 votes (6.96 percent) for Socialist Eugene V. Debs.
Further reading
- Standard Atlas of Sumner County, Kansas; Geo. A. Ogle & Co; 100 pages; 1918.
- Standard Atlas of Sumner County, Kansas; Geo. A. Ogle & Co; 68 pages; 1902.
- Edwards' Historical Atlas of Sumner County, Kansas; John P. Edwards; 59 pages; 1883.
External links
| Wikimedia Commons has media related to Sumner County, Kansas. |
- County
- Historical
- Sumner County Historical and Genealogical Society
- Sumner County Historical and Genealogical Research Center
- Maps
- Sumner County Maps: Current, Historic, KDOT
- Kansas Highway Maps: Current, Historic, KDOT
- Kansas Railroad Maps: Current, 1996, 1915, KDOT and Kansas Historical Society
Places adjacent to Sumner County, Kansas | ||||||||||
|---|---|---|---|---|---|---|---|---|---|---|
| ||||||||||
Municipalities and communities of Sumner County, Kansas, United States | ||
|---|---|---|
| Cities | Map of Kansas highlighting Sumner County | |
| CDP | ||
| Unincorporated communities | ||
| Ghost towns |
| |
| Footnotes | ‡This populated place also has portions in an adjacent county or counties | |
| Authority control |
|
|---|