Washburn County, Wisconsin
Washburn County is a county in the U.S. state of Wisconsin. It is named after Governor Cadwallader C. Washburn.[1] As of the 2010 census, the population was 15,911.[2] Its county seat is Shell Lake.[3] The county was created in 1883.[4]
Washburn County | |
|---|---|
 Historical Museum in Shell Lake, Wisconsin | |
 Location within the U.S. state of Wisconsin | |
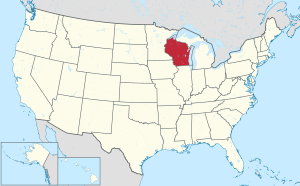 Wisconsin's location within the U.S. | |
| Coordinates: 45°54′N 91°47′W | |
| Country | |
| State | |
| Founded | 1883 |
| Named for | Cadwallader C. Washburn |
| Seat | Shell Lake |
| Largest city | Spooner |
| Area | |
| • Total | 853 sq mi (2,210 km2) |
| • Land | 797 sq mi (2,060 km2) |
| • Water | 56 sq mi (150 km2) 6.6%% |
| Population (2010) | |
| • Total | 15,911 |
| • Estimate (2019) | 15,720 |
| • Density | 19/sq mi (7.2/km2) |
| Time zone | UTC−6 (Central) |
| • Summer (DST) | UTC−5 (CDT) |
| Congressional district | 7th |
| Website | www |
Geography
According to the U.S. Census Bureau, the county has a total area of 853 square miles (2,210 km2), of which 797 square miles (2,060 km2) is land and 56 square miles (150 km2) (6.6%) is water.[5]
Major highways


Airport
Shell Lake Municipal Airport (KSSQ) serves the county and surrounding communities.
Adjacent counties
- Douglas County - north
- Bayfield County - northeast
- Sawyer County - east
- Rusk County - southeast
- Barron County - south
- Burnett County - west
National protected area
Demographics
| Historical population | |||
|---|---|---|---|
| Census | Pop. | %± | |
| 1890 | 2,926 | — | |
| 1900 | 5,521 | 88.7% | |
| 1910 | 8,196 | 48.5% | |
| 1920 | 11,377 | 38.8% | |
| 1930 | 11,103 | −2.4% | |
| 1940 | 12,496 | 12.5% | |
| 1950 | 11,665 | −6.7% | |
| 1960 | 10,301 | −11.7% | |
| 1970 | 10,601 | 2.9% | |
| 1980 | 13,174 | 24.3% | |
| 1990 | 13,772 | 4.5% | |
| 2000 | 16,036 | 16.4% | |
| 2010 | 15,911 | −0.8% | |
| Est. 2019 | 15,720 | [6] | −1.2% |
| U.S. Decennial Census[7] 1790–1960[8] 1900–1990[9] 1990–2000[10] 2010–2019[2] | |||

As of the 2000 census,[11] there were 16,036 people, 6,604 households, and 4,530 families residing in the county. The population density was 20 people per square mile (8/km²). There were 10,814 housing units at an average density of 13 per square mile (5/km²). The racial makeup of the county was 97.27% White, 0.17% Black or African American, 1.01% Native American, 0.19% Asian, 0.02% Pacific Islander, 0.12% from other races, and 1.22% from two or more races. 0.89% of the population were Hispanic or Latino of any race. 33.9% were of German, 11.4% Norwegian, 7.0% Irish, 6.2% Swedish, 6.1% English and 5.6% American ancestry.
There were 6,604 households out of which 27.5% had children under the age of 18 living with them, 57.6% were married couples living together, 7.0% had a female householder with no husband present, and 31.4% were non-families. 26.7% of all households were made up of individuals and 12.6% had someone living alone who was 65 years of age or older. The average household size was 2.39 and the average family size was 2.88.
In the county, the population was spread out with 23.8% under the age of 18, 5.8% from 18 to 24, 24.7% from 25 to 44, 27.1% from 45 to 64, and 18.5% who were 65 years of age or older. The median age was 42 years. For every 100 females there were 101.3 males. For every 100 females age 18 and over, there were 98.3 males.
In 2017, there were 153 births, giving a general fertility rate of 70.0 births per 1000 women aged 15–44, the 17th highest rate out of all 72 Wisconsin counties.[12] Additionally, there were fewer than five reported induced abortions performed on women of Washburn County residence in 2017.[13]
Communities
Cities
- Shell Lake (county seat)
- Spooner
Towns
Census-designated places
- Springbrook
- Stone Lake (part)
- Trego
Other unincorporated communities
Ghost towns
Politics
| Year | Republican | Democratic | Third parties |
|---|---|---|---|
| 2016 | 59.1% 5,436 | 35.7% 3,282 | 5.2% 475 |
| 2012 | 50.6% 4,699 | 47.9% 4,447 | 1.5% 141 |
| 2008 | 47.2% 4,303 | 51.5% 4,693 | 1.3% 116 |
| 2004 | 49.8% 4,762 | 49.2% 4,705 | 1.1% 100 |
| 2000 | 48.6% 3,912 | 45.9% 3,695 | 5.4% 438 |
| 1996 | 38.6% 2,703 | 46.2% 3,231 | 15.2% 1,062 |
| 1992 | 33.7% 2,586 | 40.1% 3,080 | 26.3% 2,020 |
| 1988 | 47.3% 3,074 | 52.2% 3,393 | 0.6% 39 |
| 1984 | 54.4% 3,848 | 45.1% 3,188 | 0.6% 40 |
| 1980 | 46.4% 3,193 | 46.1% 3,172 | 7.5% 515 |
| 1976 | 43.2% 2,787 | 54.3% 3,503 | 2.5% 161 |
| 1972 | 56.8% 3,220 | 41.2% 2,336 | 1.9% 109 |
| 1968 | 47.6% 2,425 | 44.7% 2,273 | 7.7% 393 |
| 1964 | 36.8% 1,865 | 62.8% 3,181 | 0.3% 16 |
| 1960 | 54.1% 2,848 | 45.6% 2,398 | 0.3% 15 |
| 1956 | 58.9% 2,798 | 40.7% 1,935 | 0.4% 19 |
| 1952 | 60.8% 3,184 | 38.9% 2,039 | 0.3% 14 |
| 1948 | 41.8% 2,059 | 55.0% 2,708 | 3.2% 158 |
| 1944 | 53.9% 2,441 | 45.4% 2,059 | 0.7% 33 |
| 1940 | 48.7% 2,805 | 50.4% 2,901 | 1.0% 56 |
| 1936 | 31.6% 1,650 | 61.7% 3,220 | 6.6% 345 |
| 1932 | 34.7% 1,501 | 60.5% 2,619 | 4.8% 208 |
| 1928 | 70.0% 2,898 | 28.8% 1,192 | 1.2% 48 |
| 1924 | 38.9% 1,422 | 4.3% 158 | 56.8% 2,075 |
| 1920 | 78.3% 2,023 | 13.6% 352 | 8.1% 210 |
| 1916 | 55.4% 938 | 38.0% 644 | 6.6% 112 |
| 1912 | 27.5% 409 | 26.8% 398 | 45.7% 679 |
| 1908 | 69.0% 1,114 | 24.5% 396 | 6.4% 104 |
| 1904 | 77.3% 989 | 16.2% 207 | 6.5% 83 |
| 1900 | 74.0% 808 | 23.2% 253 | 2.8% 31 |
| 1896 | 73.3% 771 | 23.8% 250 | 3.0% 31 |
| 1892 | 57.8% 488 | 36.1% 305 | 6.1% 51 |
References
- "Here's How Iron Got Its Name". The Rhinelander Daily News. June 16, 1932. p. 2. Retrieved August 24, 2014 – via Newspapers.com.

- "State & County QuickFacts". United States Census Bureau. Retrieved January 24, 2014.
- "Find a County". National Association of Counties. Retrieved June 7, 2011.
- "Wisconsin: Individual County Chronologies". Wisconsin Atlas of Historical County Boundaries. The Newberry Library. 2007. Retrieved August 15, 2015.
- "2010 Census Gazetteer Files". United States Census Bureau. August 22, 2012. Retrieved August 9, 2015.
- "Population and Housing Unit Estimates". Retrieved March 26, 2020.
- "U.S. Decennial Census". United States Census Bureau. Retrieved August 9, 2015.
- "Historical Census Browser". University of Virginia Library. Retrieved August 9, 2015.
- Forstall, Richard L., ed. (March 27, 1995). "Population of Counties by Decennial Census: 1900 to 1990". United States Census Bureau. Retrieved August 9, 2015.
- "Census 2000 PHC-T-4. Ranking Tables for Counties: 1990 and 2000" (PDF). United States Census Bureau. April 2, 2001. Retrieved August 9, 2015.
- "U.S. Census website". United States Census Bureau. Retrieved May 14, 2011.
- Annual Wisconsin Birth and Infant Mortality Report, 2017 P-01161-19 (June 2019): Detailed Tables
- Reported Induced Abortions in Wisconsin, Office of Health Informatics, Division of Public Health, Wisconsin Department of Health Services. Section: Trend Information, 2013-2017, Table 18, pages 17-18
- Leip, David. "Dave Leip's Atlas of U.S. Presidential Elections". uselectionatlas.org. Retrieved August 14, 2018.
External links
| Wikimedia Commons has media related to Washburn County, Wisconsin. |
- Washburn County website
- Washburn County map from the Wisconsin Department of Transportation
- Washburn County tourism website
Places adjacent to Washburn County, Wisconsin | ||||||||||
|---|---|---|---|---|---|---|---|---|---|---|
| ||||||||||
Municipalities and communities of Washburn County, Wisconsin, United States | ||
|---|---|---|
| Cities | | |
| Villages | ||
| Towns | ||
| CDPs | ||
| Unincorporated communities | ||
| Ghost town/neighborhood | ||
| Indian reservation | ||
| Footnotes | ‡This populated place also has portions in an adjacent county or counties | |
| Authority control |
|
|---|