1991 Castilian-Leonese regional election
The 1991 Castilian-Leonese regional election was held on Sunday, 26 May 1991, to elect the 3rd Cortes of the autonomous community of Castile and León. All 84 seats in the Cortes were up for election. The election was held simultaneously with regional elections in twelve other autonomous communities and local elections all throughout Spain.
| |||||||||||||||||||||||||||||||||||||||||||||||||||||||||||||||||||||||||||||||
All 84 seats in the Cortes of Castile and León 43 seats needed for a majority | |||||||||||||||||||||||||||||||||||||||||||||||||||||||||||||||||||||||||||||||
|---|---|---|---|---|---|---|---|---|---|---|---|---|---|---|---|---|---|---|---|---|---|---|---|---|---|---|---|---|---|---|---|---|---|---|---|---|---|---|---|---|---|---|---|---|---|---|---|---|---|---|---|---|---|---|---|---|---|---|---|---|---|---|---|---|---|---|---|---|---|---|---|---|---|---|---|---|---|---|---|
| Opinion polls | |||||||||||||||||||||||||||||||||||||||||||||||||||||||||||||||||||||||||||||||
| Registered | 2,069,469 | ||||||||||||||||||||||||||||||||||||||||||||||||||||||||||||||||||||||||||||||
| Turnout | 1,398,238 (67.6%) | ||||||||||||||||||||||||||||||||||||||||||||||||||||||||||||||||||||||||||||||
| |||||||||||||||||||||||||||||||||||||||||||||||||||||||||||||||||||||||||||||||
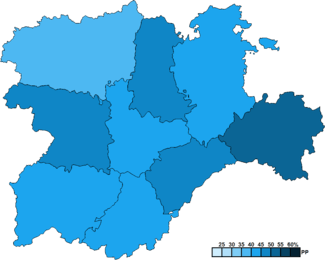 Constituency results map for the Cortes of Castile and León | |||||||||||||||||||||||||||||||||||||||||||||||||||||||||||||||||||||||||||||||
| |||||||||||||||||||||||||||||||||||||||||||||||||||||||||||||||||||||||||||||||
.jpg)
.jpg)

Overview
Electoral system
The Cortes of Castile and León were the devolved, unicameral legislature of the autonomous community of Castile and León, having legislative power in regional matters as defined by the Spanish Constitution and the Castilian-Leonese Statute of Autonomy, as well as the ability to vote confidence in or withdraw it from a President of the Junta.[1] Voting for the Cortes was on the basis of universal suffrage, which comprised all nationals over eighteen, registered in Castile and León and in full enjoyment of their political rights.
All members of the Cortes of Castile and León were elected using the D'Hondt method and a closed list proportional representation, with a threshold of 3 percent of valid votes—which included blank ballots—being applied in each constituency. Parties not reaching the threshold were not taken into consideration for seat distribution. Additionally, the use of the D'Hondt method might result in an effective threshold over three percent, depending on the district magnitude.[2] Seats were allocated to constituencies, corresponding to the provinces of Ávila, Burgos, León, Palencia, Salamanca, Segovia, Soria, Valladolid and Zamora. Each constituency was entitled to an initial minimum of three seats, being allocated one additional member per each 45,000 inhabitants or fraction greater than 22,500.[1][3]
The electoral law provided that parties, federations, coalitions and groupings of electors were allowed to present lists of candidates. However, groupings of electors were required to secure the signature of at least 1 percent of the electors registered in the constituency for which they sought election. Electors were barred from signing for more than one list of candidates. Concurrently, parties and federations intending to enter in coalition to take part jointly at an election were required to inform the relevant Electoral Commission within ten days of the election being called.[3][4][5]
Election date
The term of the Cortes of Castile and León expired four years after the date of their previous election. Legal amendments earlier in 1991 established that elections to the Cortes were to be fixed for the fourth Sunday of May every four years. The previous election was held on 10 June 1987, setting the election date for the Cortes on Sunday, 26 May 1991.[1][3][4][5]
The Cortes of Castile and León could not be dissolved before the date of expiry of parliament except in the event of an investiture process failing to elect a regional President within a two-month period from the first ballot. In such a case, the Cortes were to be automatically dissolved and a snap election called, with elected procurators merely serving out what remained of their four-year terms.[1]
Opinion polls
The table below lists voting intention estimates in reverse chronological order, showing the most recent first and using the dates when the survey fieldwork was done, as opposed to the date of publication. Where the fieldwork dates are unknown, the date of publication is given instead. The highest percentage figure in each polling survey is displayed with its background shaded in the leading party's colour. If a tie ensues, this is applied to the figures with the highest percentages. The "Lead" column on the right shows the percentage-point difference between the parties with the highest percentages in a given poll. When available, seat projections are also displayed below the voting estimates in a smaller font. 43 seats were required for an absolute majority in the Cortes of Castile and León.
| Polling firm/Commissioner | Fieldwork date | Sample size | Turnout | Lead | |||||||
|---|---|---|---|---|---|---|---|---|---|---|---|
| 1991 regional election | 26 May 1991 | N/A | 67.6 | [lower-alpha 2] | 36.4 35 |
8.1 5 |
5.4 1 |
[lower-alpha 2] | [lower-alpha 2] | 43.5 43 |
7.1 |
| Sigma Dos/El Mundo[p 1][p 2] | 18 May 1991 | ? | ? | [lower-alpha 2] | 35.2 32/34 |
9.3 6/7 |
6.8 1/3 |
[lower-alpha 2] | [lower-alpha 2] | 42.8 42/43 |
7.6 |
| Metra Seis/El Independiente[p 1][p 2] | 12 May 1991 | ? | ? | [lower-alpha 2] | 34.2 33/34 |
11.6 8/9 |
5.7 1 |
[lower-alpha 2] | [lower-alpha 2] | 39.4 40 |
5.2 |
| Demoscopia/El País[p 1][p 2][p 3][p 4] | 4–7 May 1991 | 1,450 | ? | [lower-alpha 2] | 32.2 28/33 |
7.2 2/4 |
7.7 3/4 |
[lower-alpha 2] | [lower-alpha 2] | 46.6 43/47 |
14.4 |
| 1989 general election | 29 Oct 1989 | N/A | 73.3 | [lower-alpha 2] | 35.6 34 |
12.8 8 |
6.7 3 |
[lower-alpha 2] | [lower-alpha 2] | 40.2 39 |
4.6 |
| 1989 EP election | 15 Jun 1989 | N/A | 57.5 | [lower-alpha 2] | 36.4 37 |
13.2 12 |
4.0 1 |
[lower-alpha 2] | [lower-alpha 2] | 32.3 34 |
4.1 |
| 1987 regional election | 10 Jun 1987 | N/A | 73.2 | 34.4 32 |
34.0 32 |
19.4 18 |
3.8 0 |
2.4 1 |
1.3 1 |
– | 0.4 |
Results
Overall
 | ||||||
| Parties and coalitions | Popular vote | Seats | ||||
|---|---|---|---|---|---|---|
| Votes | % | ±pp | Total | +/− | ||
| People's Party (PP)1 | 602,773 | 43.52 | +5.23 | 43 | +9 | |
| Spanish Socialist Workers' Party (PSOE) | 504,709 | 36.44 | +2.43 | 35 | +3 | |
| Democratic and Social Centre (CDS) | 112,821 | 8.14 | –11.23 | 5 | –13 | |
| United Left (IU) | 74,197 | 5.36 | +1.55 | 1 | +1 | |
| The Greens (LV) | 20,193 | 1.46 | New | 0 | ±0 | |
| Leonese People's Union (UPL) | 11,432 | 0.83 | +0.21 | 0 | ±0 | |
| Burgalese Popular Action (APB) | 6,493 | 0.47 | New | 0 | ±0 | |
| Regionalist Democracy of Castile and León (DRCL) | 4,587 | 0.33 | New | 0 | ±0 | |
| Party of El Bierzo (PB) | 4,465 | 0.32 | –0.06 | 0 | ±0 | |
| Bercian Left (IB) | 3,407 | 0.25 | New | 0 | ±0 | |
| Castilian Regionalist Party (PREC) | 3,042 | 0.22 | New | 0 | ±0 | |
| Castilianist Union (UC) | 2,229 | 0.16 | New | 0 | ±0 | |
| Independent Progressive Union (UPI) | 2,127 | 0.15 | New | 0 | ±0 | |
| Regionalist Party of the Leonese Country (PREPAL) | 2,123 | 0.15 | –0.13 | 0 | ±0 | |
| Commoners' Land (TC) | 1,900 | 0.14 | New | 0 | ±0 | |
| The Greens Ecologist–Humanist List (LVLE–H)2 | 1,622 | 0.12 | –0.15 | 0 | ±0 | |
| Palentine Unity (UP) | 1,558 | 0.11 | New | 0 | ±0 | |
| Spanish Phalanx of the CNSO (FE–JONS) | 895 | 0.06 | –0.07 | 0 | ±0 | |
| Communist Party of the Peoples of Spain (PCPE) | 873 | 0.06 | New | 0 | ±0 | |
| Left Unitary Platform (PCE (m–l)–CRPE) | 435 | 0.03 | New | 0 | ±0 | |
| Nationalist Party of Castile and León (PANCAL) | 298 | 0.02 | –0.34 | 0 | ±0 | |
| Blank ballots | 23,028 | 1.66 | +0.08 | |||
| Total | 1,385,207 | 84 | ±0 | |||
| Valid votes | 1,385,207 | 99.07 | +0.79 | |||
| Invalid votes | 13,031 | 0.93 | –0.79 | |||
| Votes cast / turnout | 1,398,238 | 67.57 | –5.58 | |||
| Abstentions | 671,231 | 32.43 | +5.58 | |||
| Registered voters | 2,069,469 | |||||
| Sources[6][7][8][9] | ||||||
Distribution by constituency
| Constituency | PP | PSOE | CDS | IU | ||||
|---|---|---|---|---|---|---|---|---|
| % | S | % | S | % | S | % | S | |
| Ávila | 42.3 | 3 | 26.3 | 2 | 24.8 | 2 | 3.6 | − |
| Burgos | 44.0 | 6 | 34.0 | 5 | 5.8 | − | 6.6 | − |
| León | 39.8 | 7 | 38.9 | 7 | 5.5 | 1 | 4.9 | − |
| Palencia | 45.3 | 4 | 37.2 | 3 | 6.7 | − | 5.3 | − |
| Salamanca | 44.5 | 5 | 39.5 | 5 | 7.8 | 1 | 4.0 | − |
| Segovia | 46.1 | 4 | 32.4 | 2 | 11.0 | − | 5.8 | − |
| Soria | 52.3 | 3 | 33.9 | 2 | 6.4 | − | 2.7 | − |
| Valladolid | 42.6 | 7 | 38.4 | 6 | 5.2 | − | 8.2 | 1 |
| Zamora | 45.4 | 4 | 37.6 | 3 | 9.9 | 1 | 3.4 | − |
| Total | 43.5 | 43 | 36.4 | 35 | 8.1 | 5 | 5.4 | 1 |
| Sources[6][7][8][9] | ||||||||
Aftermath
| Investiture Juan José Lucas (PP) | ||
| Ballot → | 4 July 1991 | |
|---|---|---|
| Required majority → | 43 out of 84 | |
Yes
|
43 / 84 | |
40 / 84 | ||
| Abstentions | 0 / 84 | |
Absentees
|
1 / 84 | |
| Sources[9] | ||
References
- Opinion poll sources
- "Seis comunidades dependen de pactos". ABC (in Spanish). 20 May 1991.
- "Las elecciones de 26-5-91". CEPC (in Spanish). August 1991.
- "Lucas gobernará a sus anchas". El País (in Spanish). 19 May 1991.
- "Ficha técnica". El País (in Spanish). 19 May 1991.
- Other
- "Statute of Autonomy of Castile and León of 1983". Organic Law No. 4 of 25 February 1983. Official State Gazette (in Spanish). Retrieved 16 September 2017.
- Gallagher, Michael (30 July 2012). "Effective threshold in electoral systems". Trinity College, Dublin. Archived from the original on 30 July 2017. Retrieved 22 July 2017.
- "Castile and León Electoral Law of 1987". Law No. 3 of 30 March 1987. Official Gazette of Castile and León (in Spanish). Retrieved 15 September 2017.
- "General Electoral System Organic Law of 1985". Organic Law No. 5 of 19 June 1985. Official State Gazette (in Spanish). Retrieved 28 December 2016.
- "Representation of the people Institutional Act". www.juntaelectoralcentral.es. Central Electoral Commission. Retrieved 16 June 2017.
- "Elections to the Cortes of Castile and León". servicios.jcyl.es (in Spanish). Junta of Castile and León. Retrieved 14 January 2018.
- "Cortes of Castile and León election results, 26 May 1991" (PDF). www.juntaelectoralcentral.es (in Spanish). Electoral Commission of Castile and León. 3 July 1991. Retrieved 24 September 2017.
- "Number 153. Report-declaration of the Cortes of Castile and León election of 26 May 1991" (PDF). tcu.es (in Spanish). Court of Auditors. Retrieved 8 December 2019.
- "Cortes of Castile and León elections since 1983". historiaelectoral.com (in Spanish). Electoral History. Retrieved 24 September 2017.
| Regional elections | |
|---|---|
| General elections | |
| European Parliament elections | |
| Local elections | |