1976 United States presidential election in South Carolina
The 1976 United States presidential election in South Carolina took place on November 2, 1976. All 50 states and the District of Columbia were part of the 1976 United States presidential election. South Carolina voters chose 8 electors to the Electoral College, who voted for president and vice president.
| ||||||||||||||||||||||||||
| ||||||||||||||||||||||||||
 County Results
| ||||||||||||||||||||||||||
| ||||||||||||||||||||||||||
.jpg)
South Carolina voted for the Democratic nominee, former Georgia Governor Jimmy Carter, and his running mate Walter Mondale over the Republican nominee, President Gerald Ford and his running mate Senator Bob Dole. Carter won South Carolina by a margin of 13.04% above Ford.[1]
Ford managed to carry just three of South Carolina's counties, while Nixon managed to carry all 46 counties four years earlier. As of the 2016 presidential election, this is the last time that the Democratic nominee carried South Carolina, the last time a Democrat won Horry County, Spartanburg County, Berkeley County, Beaufort County, Dorchester County, Florence County, Pickens County, Kershaw County, and Newberry County,[2] and the last time a Democrat swept every congressional district in the state.
Results
| United States presidential election in South Carolina, 1976[1] | |||||
|---|---|---|---|---|---|
| Party | Candidate | Votes | Percentage | Electoral votes | |
| Democratic | Jimmy Carter | 450,825 | 56.17% | 8 | |
| Republican | Gerald Ford | 346,140 | 43.13% | 0 | |
| American | Thomas Anderson | 2,997 | 0.37% | 0 | |
| American Independent Party | Lester Maddox | 1,951 | 0.24% | 0 | |
| Write-ins | Write-ins | 681 | 0.08% | 0 | |
| Totals | 802,594 | 99.99% | 8 | ||
| Voter turnout | - | ||||
Results by county
| County | James Earl Carter
Democratic |
Gerald Rudolph Ford
Republican |
Other candidates
Various parties |
Total votes cast | |||
|---|---|---|---|---|---|---|---|
| # | % | # | % | # | % | ||
| Abbeville | 4,700 | 72.06% | 1,791 | 27.46% | 31 | 0.48% | 6,522 |
| Aiken | 14,927 | 47.88% | 16,011 | 51.36% | 235 | 0.75% | 31,173 |
| Allendale | 2,634 | 71.02% | 1,064 | 28.69% | 11 | 0.30% | 3,709 |
| Anderson | 19,002 | 66.32% | 9,496 | 33.14% | 156 | 0.54% | 28,654 |
| Bamberg | 3,330 | 63.84% | 1,849 | 35.45% | 37 | 0.71% | 5,216 |
| Barnwell | 4,083 | 61.38% | 2,569 | 38.62% | 0 | 0.00% | 6,652 |
| Beaufort | 6,049 | 50.29% | 5,935 | 49.34% | 45 | 0.37% | 12,029 |
| Berkeley | 9,741 | 58.05% | 6,981 | 41.60% | 59 | 0.35% | 16,781 |
| Calhoun | 2,055 | 59.29% | 1,382 | 39.87% | 29 | 0.84% | 3,466 |
| Charleston | 34,328 | 49.64% | 34,010 | 49.18% | 817 | 1.18% | 69,155 |
| Cherokee | 7,765 | 66.19% | 3,931 | 33.51% | 36 | 0.31% | 11,732 |
| Chester | 5,200 | 63.32% | 2,982 | 36.31% | 30 | 0.37% | 8,212 |
| Chesterfield | 7,687 | 75.04% | 2,537 | 24.77% | 20 | 0.20% | 10,244 |
| Clarendon | 5,489 | 64.13% | 3,040 | 35.52% | 30 | 0.35% | 8,559 |
| Colleton | 5,134 | 60.24% | 3,324 | 39.00% | 64 | 0.75% | 8,522 |
| Darlington | 10,165 | 60.16% | 6,678 | 39.52% | 54 | 0.32% | 16,897 |
| Dillon | 5,089 | 66.62% | 2,527 | 33.08% | 23 | 0.30% | 7,639 |
| Dorchester | 8,046 | 54.44% | 6,695 | 45.30% | 38 | 0.26% | 14,779 |
| Edgefield | 3,216 | 62.60% | 1,879 | 36.58% | 42 | 0.82% | 5,137 |
| Fairfield | 4,153 | 69.36% | 1,817 | 30.34% | 18 | 0.30% | 5,988 |
| Florence | 16,294 | 54.49% | 13,539 | 45.27% | 71 | 0.24% | 29,904 |
| Georgetown | 7,169 | 63.54% | 4,058 | 35.97% | 56 | 0.50% | 11,283 |
| Greenville | 35,943 | 47.31% | 39,099 | 51.46% | 939 | 1.24% | 75,981 |
| Greenwood | 9,976 | 62.39% | 5,974 | 37.36% | 41 | 0.26% | 15,991 |
| Hampton | 3,923 | 68.56% | 1,773 | 30.99% | 26 | 0.45% | 5,722 |
| Horry | 15,720 | 62.59% | 9,339 | 37.18% | 58 | 0.23% | 25,117 |
| Jasper | 2,903 | 70.12% | 1,221 | 29.49% | 16 | 0.39% | 4,140 |
| Kershaw | 6,211 | 50.08% | 6,126 | 49.40% | 65 | 0.52% | 12,402 |
| Lancaster | 8,324 | 62.19% | 4,997 | 37.33% | 64 | 0.48% | 13,385 |
| Laurens | 7,440 | 57.98% | 5,300 | 41.31% | 91 | 0.71% | 12,831 |
| Lee | 3,869 | 61.86% | 2,357 | 37.69% | 28 | 0.45% | 6,254 |
| Lexington | 14,339 | 39.75% | 21,442 | 59.43% | 296 | 0.82% | 36,077 |
| McCormick | 1,774 | 73.09% | 640 | 26.37% | 13 | 0.54% | 2,427 |
| Marion | 5,927 | 65.74% | 3,076 | 34.12% | 13 | 0.14% | 9,016 |
| Marlboro | 5,409 | 73.32% | 1,961 | 26.58% | 7 | 0.09% | 7,377 |
| Newberry | 5,034 | 50.26% | 4,931 | 49.23% | 51 | 0.51% | 10,016 |
| Oconee | 8,447 | 68.61% | 3,805 | 30.90% | 60 | 0.49% | 12,312 |
| Orangeburg | 13,652 | 60.40% | 8,794 | 38.90% | 158 | 0.70% | 22,604 |
| Pickens | 8,505 | 51.07% | 8,029 | 48.21% | 121 | 0.73% | 16,655 |
| Richland | 36,855 | 52.68% | 32,727 | 46.78% | 380 | 0.54% | 69,962 |
| Saluda | 2,715 | 56.11% | 2,085 | 43.09% | 39 | 0.81% | 4,839 |
| Spartanburg | 27,925 | 57.32% | 20,456 | 41.99% | 336 | 0.69% | 48,717 |
| Sumter | 10,471 | 52.59% | 9,332 | 46.87% | 109 | 0.55% | 19,912 |
| Union | 6,363 | 64.51% | 3,463 | 35.11% | 37 | 0.38% | 9,863 |
| Williamsburg | 8,745 | 62.22% | 5,275 | 37.53% | 35 | 0.25% | 14,055 |
| York | 14,099 | 58.73% | 9,843 | 41.00% | 63 | 0.26% | 24,005 |
| Totals | 450,825 | 56.22% | 346,140 | 43.16% | 4,948 | 0.62% | 801,913 |
References
- "1976 Presidential General Election Results - South Carolina". Dave Leip's Atlas of U.S. Presidential Elections. Retrieved 2016-08-24.
- Sullivan, Robert David; ‘How the Red and Blue Map Evolved Over the Past Century’; America Magazine in The National Catholic Review; June 29, 2016
State and district results of the 1976 United States presidential election | ||
|---|---|---|
| 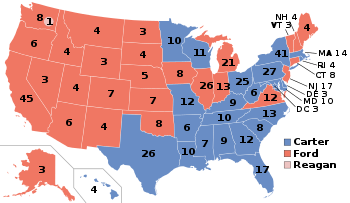 | |