1992 United States presidential election in South Carolina
The 1992 United States presidential election in South Carolina took place on November 3, 1992, as part of the 1992 United States presidential election. Voters chose 8 representatives, or electors to the Electoral College, who voted for president and vice president.
| |||||||||||||||||||||||||||||||||
| |||||||||||||||||||||||||||||||||
 County Results
| |||||||||||||||||||||||||||||||||
| |||||||||||||||||||||||||||||||||
.jpg)
South Carolina was won by incumbent President George H. W. Bush (R-Texas) with 48.02% of the popular vote over Governor Bill Clinton (D-Arkansas) with 39.88%. Businessman Ross Perot (I-Texas) finished in third, with 11.55% of the popular vote.[1] Clinton ultimately won the national vote, defeating both incumbent President Bush and Perot.[2]
This election marked the completion of South Carolina's transformation from one of the strongest Democratic states in the country to a reliably Republican one. For every election from 1880 to 1960, South Carolina had voted for the Democratic nominee, almost always by wide margins and by percentages of over nine-tenths in every election from 1900 to 1944.[3] However, ever since Barry Goldwater carried the state in 1964, the state had lost its "Safe Democratic" status and moved towards the Republicans, being carried by them in five out of the preceding 6 elections and being won only by native Southerner Jimmy Carter. Even as liberal and secular New England states such as Vermont trended towards the Democrats with the conservative movement in the 1980s, South Carolina, a conservative and religious Southern state, would trend towards the Republicans along with other states of the Deep South. From this election onward, it and the others would be considered safe red states.
At the time of the election, Clinton was only the second Democrat to win without carrying South Carolina, along with Lyndon B. Johnson. As of the 2016 presidential election, this is the last election in which Edgefield County voted for a Democratic presidential candidate. [4] This is the first election in which any South Carolina county cast more than one hundred thousand votes, namely Greenville and Richland.
With 48.02% of the popular vote, South Carolina would prove to be Bush's second strongest state in the 1992 election after Mississippi.[5]
Results
| United States presidential election in South Carolina, 1992[1] | |||||
|---|---|---|---|---|---|
| Party | Candidate | Votes | Percentage | Electoral votes | |
| Republican | George H. W. Bush | 577,507 | 48.02% | 8 | |
| Democratic | Bill Clinton | 479,514 | 39.88% | 0 | |
| Independent | Ross Perot | 138,872 | 11.55% | 0 | |
| Libertarian | Andre Marrou | 2,719 | 0.23% | 0 | |
| U.S. Taxpayers' | Howard Phillips | 2,680 | 0.22% | 0 | |
| New Alliance | Lenora Fulani | 1,235 | 0.10% | 0 | |
| Totals | 1,202,527 | 100.0% | 8 | ||
Results by county
| George Herbert Walker Bush Republican |
William Jefferson Clinton Democratic |
Henry Ross Perot Independent |
Various candidates Other parties |
Margin | Total votes cast | ||||||
|---|---|---|---|---|---|---|---|---|---|---|---|
| County | # | % | # | % | # | % | # | % | # | % | # |
| Abbeville | 3,317 | 39.76% | 3,968 | 47.56% | 1,036 | 12.42% | 22 | 0.26% | -651 | -7.80% | 8,343 |
| Aiken | 25,731 | 55.01% | 14,802 | 31.64% | 6,056 | 12.95% | 189 | 0.40% | 10,929 | 23.36% | 46,778 |
| Allendale | 1,049 | 30.36% | 2,159 | 62.49% | 212 | 6.14% | 35 | 1.01% | -1,110 | -32.13% | 3,455 |
| Anderson | 24,793 | 51.68% | 16,072 | 33.50% | 6,966 | 14.52% | 140 | 0.29% | 8,721 | 18.18% | 47,971 |
| Bamberg | 1,906 | 33.28% | 3,426 | 59.82% | 360 | 6.29% | 35 | 0.61% | -1,520 | -26.54% | 5,727 |
| Barnwell | 4,026 | 49.24% | 3,344 | 40.90% | 752 | 9.20% | 55 | 0.67% | 682 | 8.34% | 8,177 |
| Beaufort | 14,735 | 47.10% | 11,466 | 36.65% | 4,966 | 15.87% | 120 | 0.38% | 3,269 | 10.45% | 31,287 |
| Berkeley | 18,048 | 50.87% | 12,533 | 35.33% | 4,632 | 13.06% | 266 | 0.75% | 5,515 | 15.54% | 35,479 |
| Calhoun | 2,418 | 41.85% | 2,770 | 47.94% | 564 | 9.76% | 26 | 0.45% | -352 | -6.09% | 5,778 |
| Charleston | 47,403 | 48.00% | 40,095 | 40.60% | 10,354 | 10.49% | 897 | 0.91% | 7,308 | 7.40% | 98,749 |
| Cherokee | 6,887 | 47.31% | 5,453 | 37.46% | 2,186 | 15.02% | 31 | 0.21% | 1,434 | 9.85% | 14,557 |
| Chester | 3,451 | 33.54% | 5,458 | 53.05% | 1,350 | 13.12% | 29 | 0.28% | -2,007 | -19.51% | 10,288 |
| Chesterfield | 4,183 | 37.31% | 5,691 | 50.76% | 1,315 | 11.73% | 23 | 0.21% | -1,508 | -13.45% | 11,212 |
| Clarendon | 4,147 | 37.89% | 6,033 | 55.12% | 744 | 6.80% | 21 | 0.19% | -1,886 | -17.23% | 10,945 |
| Colleton | 4,545 | 40.17% | 5,455 | 48.21% | 1,245 | 11.00% | 69 | 0.61% | -910 | -8.04% | 11,314 |
| Darlington | 8,912 | 44.00% | 9,090 | 44.88% | 1,863 | 9.20% | 388 | 1.92% | -178 | -0.88% | 20,253 |
| Dillon | 3,575 | 38.07% | 4,953 | 52.75% | 831 | 8.85% | 31 | 0.33% | -1,378 | -14.68% | 9,390 |
| Dorchester | 15,004 | 53.53% | 9,160 | 32.68% | 3,648 | 13.02% | 217 | 0.77% | 5,844 | 20.85% | 28,029 |
| Edgefield | 3,339 | 45.15% | 3,433 | 46.42% | 596 | 8.06% | 28 | 0.38% | -94 | -1.27% | 7,396 |
| Fairfield | 2,518 | 31.12% | 4,867 | 60.15% | 652 | 8.06% | 54 | 0.67% | -2,349 | -29.03% | 8,091 |
| Florence | 19,802 | 50.77% | 15,569 | 39.92% | 3,499 | 8.97% | 133 | 0.34% | 4,233 | 10.85% | 39,003 |
| Georgetown | 6,870 | 42.22% | 7,494 | 46.05% | 1,840 | 11.31% | 68 | 0.42% | -624 | -3.83% | 16,272 |
| Greenville | 65,066 | 57.12% | 34,651 | 30.42% | 13,699 | 12.03% | 491 | 0.43% | 30,415 | 26.70% | 113,907 |
| Greenwood | 9,079 | 47.98% | 7,621 | 40.27% | 2,101 | 11.10% | 122 | 0.64% | 1,458 | 7.70% | 18,923 |
| Hampton | 2,402 | 32.63% | 4,332 | 58.85% | 564 | 7.66% | 63 | 0.86% | -1,930 | -26.22% | 7,361 |
| Horry | 23,489 | 45.87% | 18,896 | 36.90% | 8,472 | 16.55% | 347 | 0.68% | 4,593 | 8.97% | 51,204 |
| Jasper | 1,725 | 29.93% | 3,453 | 59.92% | 549 | 9.53% | 36 | 0.62% | -1,728 | -29.98% | 5,763 |
| Kershaw | 8,499 | 49.12% | 6,585 | 38.06% | 2,150 | 12.43% | 67 | 0.39% | 1,914 | 11.06% | 17,301 |
| Lancaster | 7,757 | 41.58% | 8,307 | 44.53% | 2,563 | 13.74% | 28 | 0.15% | -550 | -2.95% | 18,655 |
| Laurens | 8,347 | 48.53% | 6,638 | 38.59% | 2,157 | 12.54% | 58 | 0.34% | 1,709 | 9.94% | 17,200 |
| Lee | 2,730 | 34.90% | 4,454 | 56.94% | 611 | 7.81% | 27 | 0.35% | -1,724 | -22.04% | 7,822 |
| Lexington | 41,759 | 60.50% | 18,312 | 26.53% | 8,652 | 12.54% | 299 | 0.43% | 23,447 | 33.97% | 69,022 |
| McCormick | 899 | 29.46% | 1,846 | 60.48% | 295 | 9.67% | 12 | 0.39% | -947 | -31.03% | 3,052 |
| Marion | 3,647 | 35.15% | 5,843 | 56.31% | 822 | 7.92% | 64 | 0.62% | -2,196 | -21.16% | 10,376 |
| Marlboro | 2,526 | 29.47% | 5,111 | 59.64% | 895 | 10.44% | 38 | 0.44% | -2,585 | -30.16% | 8,570 |
| Newberry | 5,980 | 48.50% | 4,896 | 39.71% | 1,393 | 11.30% | 60 | 0.49% | 1,084 | 8.79% | 12,329 |
| Oconee | 10,379 | 50.68% | 6,617 | 32.31% | 3,405 | 16.63% | 78 | 0.38% | 3,762 | 18.37% | 20,479 |
| Orangeburg | 11,328 | 35.14% | 18,440 | 57.21% | 2,383 | 7.39% | 83 | 0.26% | -7,112 | -22.06% | 32,234 |
| Pickens | 17,008 | 57.67% | 8,275 | 28.06% | 4,128 | 14.00% | 83 | 0.28% | 8,733 | 29.61% | 29,494 |
| Richland | 43,744 | 41.17% | 53,648 | 50.49% | 7,918 | 7.45% | 940 | 0.88% | -9,904 | -9.32% | 106,250 |
| Saluda | 2,968 | 47.80% | 2,393 | 38.54% | 833 | 13.42% | 15 | 0.24% | 575 | 9.26% | 6,209 |
| Spartanburg | 37,707 | 51.91% | 25,488 | 35.09% | 8,900 | 12.25% | 540 | 0.74% | 12,219 | 16.82% | 72,635 |
| Sumter | 12,576 | 47.29% | 11,852 | 44.56% | 2,062 | 7.75% | 106 | 0.40% | 724 | 2.72% | 26,596 |
| Union | 4,647 | 43.51% | 4,644 | 43.48% | 1,371 | 12.84% | 18 | 0.17% | 3 | 0.03% | 10,680 |
| Williamsburg | 5,289 | 37.05% | 8,077 | 56.57% | 864 | 6.05% | 47 | 0.33% | -2,788 | -19.53% | 14,277 |
| York | 21,297 | 48.74% | 15,844 | 36.26% | 6,418 | 14.69% | 135 | 0.31% | 5,453 | 12.48% | 43,694 |
| Totals | 577,507 | 48.02% | 479,514 | 39.88% | 138,872 | 11.55% | 6,634 | 0.55% | 97,993 | 8.15% | 1,202,527 |
Results by congressional district
| District | Bush | Clinton | Representative |
|---|---|---|---|
| 1st | 53% | 33% | Arthur Ravenel, Jr. |
| 2nd | 52% | 36% | Floyd Spence |
| 3rd | 51% | 35% | Butler Derrick |
| 4th | 54% | 33% | Bob Inglis |
| 5th | 45% | 42% | John Spratt |
| 6th | 31% | 62% | Jim Clyburn |
References
- "1992 Presidential General Election Results - South Carolina". U.S. Election Atlas. Retrieved 9 June 2012.
- "1992 Presidential General Election Results". U.S. Election Atlas. Retrieved 9 June 2012.
- "Presidential General Election Results Comparison – South Carolina". Dave Leip's U.S. Election Atlas.
- Sullivan, Robert David; ‘How the Red and Blue Map Evolved Over the Past Century’; America Magazine in The National Catholic Review; June 29, 2016
- "1992 Presidential Election Statistics". Dave Leip's Atlas of U.S. Presidential Elections. Retrieved 2018-03-05.
State and district results of the 1992 U.S. presidential election | ||
|---|---|---|
| 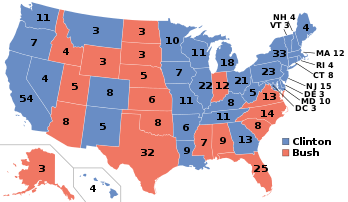 | |