South Swindon (UK Parliament constituency)
South Swindon is a constituency[n 1] in Swindon, Wiltshire, represented in the House of Commons of the UK Parliament since 2010 by Robert Buckland, a Conservative.[n 2]
| South Swindon | |
|---|---|
| County constituency for the House of Commons | |
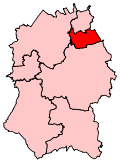
 Boundary of South Swindon in Wiltshire | |
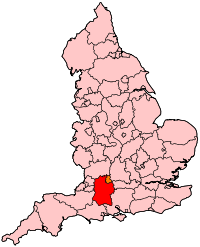
 Location of Wiltshire within England | |
| County | Wiltshire |
| Electorate | 73,449 (December 2010)[1] |
| Current constituency | |
| Created | 1997 |
| Member of Parliament | Robert Buckland (Conservative) |
| Number of members | One |
| Created from | Swindon and Devizes |
Boundaries
1997–2010: The Borough of Thamesdown wards of Central, Chiseldon, Dorcan, Eastcott, Freshbrook, Lawns, Park, Ridgeway, Toothill, Walcot, and Wroughton.
2010–present: The Borough of Swindon wards of Central, Dorcan, Eastcott, Freshbrook and Grange Park, Old Town and Lawn, Parks, Ridgeway, Shaw and Nine Elms, Toothill and Westlea, Walcot, and Wroughton and Chiseldon.
The constituency was created in 1997 from parts of the seats of Swindon that was abolished, and Devizes that remains. This seat with a population of around 93,000 incorporates the southern half of the town as well as farms and villages with hamlets to the immediate south and east of Swindon.
It used slightly amended boundaries for the 2010 election, which saw it lose South Marston to North Swindon. The border now runs from Dorcan across to Bishopstone and then down to Russley Park before running west to Barbury Castle. From there it runs north to the Roughmoor area and loops back down to incorporate West Swindon, before following the railway line east through the town and back to Dorcan. In addition to the south of Swindon, main settlements include Wroughton, Chiseldon, Wanborough and Liddington.[2]
History
Historically Swindon is a railway town and until the latter part of the 20th century the related works were the primary employer.[3] Today Swindon is the home of a number of large companies, examples specific to South Swindon include Intel's European headquarters,[4] Nationwide's headquarters[5] and Zurich Financial Services' UK headquarters.
- Members
Created in 1997, the Swindon South constituency, swinging in line with the national average in the New Labour landslide, produced a fairly safe majority for the Labour winner. Julia Drown had a lead of more than 5,000 which was extended in 2001 to more than 7,000 but then dropped dramatically on a new candidate's selection, to just 1,353 in 2005. In 2010 Robert Buckland, a Conservative, gained South Swindon at the general election with a majority of just over 3500. In 2015, the Conservative majority increased to 5785; in 2017, the Conservative majority fell to 2,464 on a 3.5% swing to Labour. In 2019, Buckland’s majority rose to 6625 (13%) and 52% of the vote with a swing of 4.1% to Conservative. These patterns suggest a seat that is more marginal than its neighbour North Swindon, and one which has acted as a bellwether of the national result. Incumbent MP Buckland is the current Lord Chancellor and Secretary of State for Justice.
Members of Parliament
| Election | Member[6] | Party | |
|---|---|---|---|
| 1997 | Julia Drown | Labour | |
| 2005 | Anne Snelgrove | Labour | |
| 2010 | Robert Buckland | Conservative | |
Elections
Elections in the 2010s
| Party | Candidate | Votes | % | ± | |
|---|---|---|---|---|---|
| Conservative | Robert Buckland | 26,536 | 52.3 | ||
| Labour Co-op | Sarah Church | 19,911 | 39.2 | ||
| Liberal Democrats | Stan Pajak | 4,299 | 8.5 | ||
| Majority | 6,625 | 13.1 | |||
| Turnout | 50,746 | 69.4 | |||
| Conservative hold | Swing | ||||
| Party | Candidate | Votes | % | ± | |
|---|---|---|---|---|---|
| Conservative | Robert Buckland | 24,809 | 48.4 | ||
| Labour Co-op | Sarah Church | 22,345 | 43.5 | ||
| Liberal Democrats | Stan Pajak | 2,079 | 4.1 | ||
| UKIP | Martin Costello | 1,291 | 2.5 | ||
| Green | Talis Kimberley-Fairbourn | 747 | 1.5 | ||
| Majority | 2,464 | 4.9 | |||
| Turnout | 51,358 | 71.0 | |||
| Conservative hold | Swing | ||||
| Party | Candidate | Votes | % | ± | |
|---|---|---|---|---|---|
| Conservative | Robert Buckland | 22,777 | 46.2 | ||
| Labour | Anne Snelgrove | 16,992 | 34.5 | ||
| UKIP | John Short[11] | 5,920 | 12.0 | ||
| Liberal Democrats | Damon Hooton[12] | 1,817 | 3.7 | ||
| Green | Talis Kimberley-Fairbourn[13] | 1,757 | 3.6 | ||
| Majority | 5,785 | 11.7 | |||
| Turnout | 66.6 | ||||
| Conservative hold | Swing | ||||
| Party | Candidate | Votes | % | ± | |
|---|---|---|---|---|---|
| Conservative | Robert Buckland | 19,687 | 41.8 | ||
| Labour | Anne Snelgrove | 16,143 | 34.3 | ||
| Liberal Democrats | Damon Hooton | 8,305 | 17.6 | ||
| UKIP | Robert Tingley | 2,029 | 4.3 | ||
| Green | Jenni Miles | 619 | 1.3 | ||
| Christian | Alistair Kirk | 176 | 0.4 | ||
| Independent | Karsten Evans | 160 | 0.3 | ||
| Majority | 3,544 | 7.5 | N/A | ||
| Turnout | 47,119 | 64.9 | |||
| Conservative gain from Labour | Swing | ||||
Elections in the 2000s
| Party | Candidate | Votes | % | ± | |
|---|---|---|---|---|---|
| Labour | Anne Snelgrove | 17,534 | 40.3 | ||
| Conservative | Robert Buckland | 16,181 | 37.2 | ||
| Liberal Democrats | Sue Stebbing | 7,322 | 16.8 | ||
| Green | Bill Hughes | 1,234 | 2.8 | ||
| UKIP | Stephen Halden | 955 | 2.2 | ||
| Independent | Alan Hayward | 193 | 0.4 | ||
| Independent | John Williams | 53 | 0.1 | ||
| Majority | 1,353 | 3.1 | |||
| Turnout | 43,472 | 60.2 | |||
| Labour hold | Swing | ||||
| Party | Candidate | Votes | % | ± | |
|---|---|---|---|---|---|
| Labour | Julia Drown | 22,260 | 51.3 | ||
| Conservative | Simon Coombs | 14,919 | 34.4 | ||
| Liberal Democrats | Geoff Brewer | 5,165 | 11.9 | ||
| UKIP | Vicki Sharp | 713 | 1.6 | ||
| Rock 'n' Roll Loony | Roly Gillard | 327 | 0.8 | ||
| Majority | 7,341 | 16.9 | |||
| Turnout | 43,384 | 61.0 | |||
| Labour hold | Swing | ||||
Elections in the 1990s
| Party | Candidate | Votes | % | ± | |
|---|---|---|---|---|---|
| Labour | Julia Drown | 23,943 | 46.80 | N/A | |
| Conservative | Simon Coombs | 18,298 | 35.77 | N/A | |
| Liberal Democrats | Stanley Pajak | 7,371 | 14.41 | N/A | |
| Referendum | David McIntosh | 1,273 | 2.49 | N/A | |
| Independent | Richard Charman | 181 | 0.19 | N/A | |
| Natural Law | Keith Buscombe | 96 | 0.19 | N/A | |
| Majority | 5,645 | 11.03 | N/A | ||
| Turnout | 51,162 | 72.87 | N/A | ||
| Labour win (new seat) | |||||
Neighbouring constituencies
Notes and references
- Notes
- A county constituency (for the purposes of election expenses and type of returning officer)
- As with all constituencies, the constituency elects one Member of Parliament (MP) by the first past the post system of election at least every five years.
- References
- "Electorate Figures – Boundary Commission for England". 2011 Electorate Figures. Boundary Commission for England. 4 March 2011. Archived from the original on 6 November 2010. Retrieved 13 March 2011.
- "2010 post-revision map non-metropolitan areas and unitary authorities of England" (PDF).
- "Swindon History - the GWR Works - SwindonWeb". www.swindonweb.com.
- "!company_name! - Company Profile from Hoover's".
- http://www.nationwide.co.uk/about_nationwide/accessibility/admin_centres.htm
- Leigh Rayment's Historical List of MPs – Constituencies beginning with "S" (part 6)
- Council, Swindon Borough. "Statement of Persons Nominated, Notice of Poll and Situation of Polling Stations South Swindon | Swindon Borough Council". www.swindon.gov.uk. Retrieved 16 November 2019.
- https://www.bbc.co.uk/news/politics/constituencies/E14000947
- "Labour announce candidate to contest General Election in South Swindon". Swindon Advertiser.
- "Election Data 2015". Electoral Calculus. Archived from the original on 17 October 2015. Retrieved 17 October 2015.
- "UKIP names general election candidates". Swindon Advertiser.
- http://www.libdems.org.uk/general_election_candidates#South_West
- "General Election 2015". southwest.greenparty.org.uk.
- "Election Data 2010". Electoral Calculus. Archived from the original on 26 July 2013. Retrieved 17 October 2015.
- Taylor, Stephen P (20 April 2010). "Statement of Persons Nominated and Notice of Poll" (PDF). Returning Officer. Swindone Borough Council. Retrieved 21 April 2010.
- "Election Data 2005". Electoral Calculus. Archived from the original on 15 October 2011. Retrieved 18 October 2015.
- "Election Data 2001". Electoral Calculus. Archived from the original on 15 October 2011. Retrieved 18 October 2015.
- "Election Data 1997". Electoral Calculus. Archived from the original on 15 October 2011. Retrieved 18 October 2015.