Economy of the Australian Capital Territory
The economy of the Australian Capital Territory (ACT) is the fastest-growing, sixth biggest economy of Australia as of the end of the 2017-18 financial year.[4] Since the introduction of its self-government status in 1989, and with few exceptions in 1992, 1996, and 2014, the ACT economy has exhibited positive growth at a 1991-2018 average of 3.17 percent per year.[1] A vast majority of the economy is concentrated in Canberra, the capital city of Australia, and is composed primarily (about 75%) by service industries, particularly those related to the administration of federal and local government. Construction also contributes to an important part of the economy, boosted by large government-funded projects and an active residential market. In contrast to other Australian states and territories, primary sectors such as agriculture, forestry, and mining, represent a very small proportion of the economy (±1%).[5][6] A negative balance of trade has characterised the ACT economy since 2012-13, with small goods trade and a growing service export industry comprised mainly by education and public administration services.[7]
View of Canberra, primary economic centre of the Australian Capital Territory | |
| Currency | Australian dollar (AUD) |
|---|---|
| 1 July 2018 - 30 June 2019 | |
| Statistics | |
| GDP | |
GDP growth | 4.0%[1] |
GDP per capita | |
GDP by sector | Agriculture: <1.0% Industry: 8.0% Services: 75.4% (2017-18) |
GDP by component |
|
| 1.8% | |
| 1.5% (nationally set by RBA) | |
Labour force | 236,500 |
Labour force by occupation |
|
| Unemployment | 3.6%[2] |
Average net salary | A$91,336 yearly[3] |
Main industries | |
| External | |
| Exports | A$2,230 million |
Export goods | A$21 million |
Main export partners |
|
| Imports | A$2,738 million |
Import goods | A$265 million |
Main import partners |
|
| Public finances | |
| Revenues | A$5.7 billion |
As of March 2019, the ACT exhibits the lowest unemployment rate at 3.6 percent, with almost a third of workers being employed in the public sector.[8] State inflation has been slightly greater than the national rate since mid 2017, reaching 1.8% in the year to Q1 2019.[9] As per the 2016 census, median weekly personal income was A$998, while in 2017-18 total yearly disposable income per capita was A$91,336.[10][11] Fiscal policy since 2012 has been expansionary, with gradual reductions in payroll tax rates and stamp duties (specially those related to SMS businesses and other small commercial properties). ACT SMS businesses have received government support thorough marketing and financial initiatives since 2012. The A$5.7 billion 2018-19 budget put emphasis on healthcare services, education, and justice and other community services.[12][13]
Main Economic Indicators
Gross State Product
In the 2017-18 financial year, ACT real gross state product (real GSP) was 39.44 billion dollars, which represented a 4.0% increase over the previous year. From 1990 to 2018, average real GSP yearly growth has been 3.17%, ranking 4th among all Australian jurisdictions. Real GSP per capita in 2017-2018 was $94,831, a 1.8% increase over the previous year. Nominal GSP in 2017-18 reached 39.79 billion dollars, and $95,674 per capita. Overall, the ACT account for 2.2% of the national economy as of 2018 (a figure that has averaged 2.05% from 1990-2018).[1][6]
As of June 2017, approximately 51.7% of ACT real GSP is composed by government expenditure and public gross fixed capital formation, 38.2% by household consumption (which figure includes transfer payments), 11.1% by private gross fixed capital formation (i.e. private investment), and negative 1% by net exports.[14] Main three industries by gross value added are public administration and safety (25.9%), health care services (11.0%), and professional, scientific and technical services (8.7%).[6][15]
| 2017-18
(in AUD) |
2017-18 annual growth | 1991-2018 average growth | |
|---|---|---|---|
| Real GSP | $39.44 billion | 4.0% | 3.17% |
| Real GSP per capita | $94,831 | 1.8% | 1.73% |
| Real GSI | $39.45 billion | 4.0% | 3.38% |
| Real GSI per capita | $94,853 | 1.8% | 1.97% |
| Nominal GSP | $39.79 billion | 4.9% | 5.97% |
| Nominal GSP per capita | $95,674 | 2.7% | 4.46% |
Employment
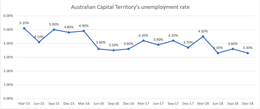
Approximately 227,900 persons are employed in the ACT as of March 2019, about 63.5% of whom are full-time workers.[10][2] As of the 2016 Census, professionals represented the largest proportion of workers (30.5%), followed by clerical and administrative workers, and managers (16.9%).[10] In terms of industry of occupation, over 30% are employed in public service jobs (including defence and safety), followed by health care and social assistance (10.4%) and education and training (9.6%).[3]
Between 2015 and mid 2019, unemployment rate has averaged 4.08%.[16] By Q1 2019, 3.6% of the 236,500 labour force remained unemployed, which was a year-on-year decrease of 0.02 percentage points. Since 2014, the participation rate in the ACT has been consistently greater than that of Australia, reaching was 72.5% in late 2017. By March 2019, the participation rate was 69.2% (3.5 percentage points higher than the national rate).[8]
Inflation and personal income
Inflation in Canberra (applies for the ACT[17]) rose by 0.1% in the first quarter of 2019, based on CPI changes from previous quarter. Year on year, CPI increased by 1.8% (by comparison, Australia rate of inflation was 1.3%), with main drivers being price increments in housing, food, and alcohol and tobacco. For the same year period, falls in the price of Furnishings, household equipment and services, as well as communications, detracted the rate of inflation by a total 0.2 percentage points.[17]
June 2018 total yearly disposable income per capita in the ACT was A$91,336, with an average growth of 5.2% in 1990-2018.[11] Median weekly personal income was A$998 in 2015-16. By the same year, family and household median weekly incomes stood at A$2,445 and A$2,070, respectively.[10] As at November 2018, the ACT holds the highest average weekly ordinary earnings (AWOTE) amongst all Australian jurisdictions at A$1,811 (in comparison to A$1,606 nationally). Specifically, AWOTE in the ACT public and private sectors was $1,968 and $1,654, respectively.[18]
| Earnings per week | Percentage of population |
|---|---|
| $1-$499 | 19.2 |
| $500-$999 | 19.1 |
| $1000-$1999 | 30.9 |
| $2000-$2999 | 10.9 |
| $3000 or more | 4.6 |
| nil income | 7.9 |
| negative income | 0.3 |
Wages and salaries grew by 0.3% (quarterly) and 2.0% (year-on-year) as measured by the December 2018 wage price index (WPI), ranking the ACT wage growth second-weakest among all Australian jurisdictions. Such a low performance is the result of a sluggish WPI growth in the private sector.[9]
In 2016, mean household net worth was A$875,482.[3]
Property market
The ACT private dwelling ownership rate in 2015-16 was 65.4%, a fall from the 67.3% rate in 2011. In the same period, rentals accounted for 31.8% of private tenure.[3]
Median house prices experienced a 2.0% fall to A$685,000 through the year to March 2019, while median unit prices increased by 4.5% to A$459,900. Overall, median residential property prices increased by 0.9% to $532,000 over the same period.[19] Such figures echoed a housing market downturn in Sydney, Melbourne and Perth that started in mid 2018.[20] From 2014 to 2019, house and unit median prices grew by 26.9% and 7.0%, respectively.[19]
According to the Q4 2018 Home Loan Affordability Report by the Real State Institute of Australia (REIA), the "proportion of family income needed to meet average loan repayments" was 20.6% in the ACT, based on a median monthly family income of A$11,817, by the end of 2018. This is a 1.0 percentage point increase from a year before. In comparison to other states and territories, ACT was the "second most affordable jurisdiction to buy", only outperformed by the Northern Territory.[21]
Number of dwelling unit commencements in Q4 2018 was 1,290, well above the 651 figure from a year before, ranking the ACT above all Australian jurisdictions by this measure.[22] In 2017-18, residential building approvals were valued at A$1.7 billion, an all-time high since 2008-09. Non-residential building approvals stood at $1.3 billion, considerably below the $1.8 billion 2008-09 peak but still well above the A$0.6 billion trough in 2011-12.[23]
The value of residential building work stood at A$476 million in the December quarter of 2018, which represents a year-on-year increase of 19.4%. Non-residential building work amounted to A$306 million for the same quarter. If engineering work is also taken into account, total construction work done in the ACT in the last quarter of 2018 was valued at A$1 billion.[24]
Business climate

By 2016-17, non-employing businesses and businesses employing 1-19 employees jointly constituted 87% of the total 27,371 businesses in the Australian Capital Territory. In the same fiscal year, net increase in the number of businesses was 1,235, the largest increase since 2013-14.[3] As of 2017-18, business counts grew by 4.4% to 28.566.[25] Construction accounts for the most popular industry in terms of number of businesses, with 5,512 as of 2017-18, followed by professional scientific and technical services (5,182), and rental, hiring, and real estate services (2,897).[25]
Since 2012, the ACT government has supported small and medium-sized business with easing payroll tax policies and the introduction of Canberra Innovation Network and Brand CBR, investment and marketing initiatives which provide funding and promotion for businesses based in the ACT.[12][26] In order to integrate key economic sectors and advanced-knowledge industries through investment incentives, the government launched the Priority Investment Program (PIP) in late 2018 with a project budget of $9.75 million.[13]
Sectors and Industries
Agriculture and forestry
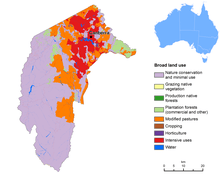
With a total land area of 2,431 km2, agriculture activity in the ACT employs approximately 15% of the territory, or 370 km2, as of 2017. Agricultural output in 2016-17 was valued at 11 million, which represented a very minor proportion (<1%) of ACT total GDP (A$37.9 billion)[1] and Australia's agricultural production (A$61 billion).[27] Cattle and calves, wool, sheep and lambs are the main components of agriculture activity, jointly accounting for 60% of total production of the 36 farms in operation as of 2016-17.[6][27]
By 2015-16, softwood plantation occupied less than 1 percent (74 km2) of the region, whereas 1,284 km2 were devoted to non-commercial production of native forests. By the same year, there were 384 workers in the ACT forestry industry, a 24% fall from 2011.[27]
As of 2017-18, agriculture, forestry, fishing, mining, and manufacturing accounted for a 1.1% total (A$428 million) of ACT gross state product.[6]
Construction
In 2017-18, construction industry in the ACT accounted for 6% of its GSP, or gross value added of A$2.4 billion.[6] Large construction projects have provided the ACT economy with important stimulus since 2017.[28] There were about 13,200 workers in this industry in 2016, or 5.8% of the ACT employed labour force. The number of construction businesses has consistently increased since 2015-16, with a total of 5,512 by June 2018. 39 percent of firms in this industry generated between A$200,000 and A$2 million in 2017-18.
Public administration and safety
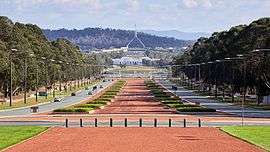
The public sector is the main driver of economic performance in the ACT, as the largest portions of both employment and economic value are sourced from it.[28][29]
In 2017-18, 25.9% of ACT GSP was made up of public administration and safety, by gross value added.[6] Total GVA of this sector reached A$10.3 billion in the same year. Public sector jobs have been on the rise since 2001, growing by 70% between 2001-2016, the largest growth in employment by occupation in the ACT.[29] As at 2016, almost a third (30.8%) of ACT workers were employed in the public sector.[3] Due to the large dependency on its public sectors, the ACT economy is volatile to changes in government spending, with the biggest economic contributions and detractions in final state growth coming from it. Such economic risk, however, has been partially offset by small agriculture and mining sectors.[30][29] In 2014, large-scale cuts in public service jobs, in conjunction with low levels of household consumption, reduced economic stimulus in subsequent years.[28][29][31]
Health care and social assistance
About A$4.4 billion (11%) was contributed to ACT GSP by health care and social assistance in 2017-18, thus being the second largest industry in the state.[6] There were 23,980 persons employed in this industry by 2016, which accounted for almost 11 percent all workers.[32]
Semi-universal health services access in Australia, in conjunction with an ageing population and technological advancements, has increased the volume of activity in this sector. Although health services in the ACT are small in comparison to other states and territories, government spending in this industry between 2007 and 2012 averaged a 10.3% grow per year (and 4.1% from 2012 to 2017).[33][30]
Other services
With manufacturing activities in the ACT having a losing relevance since the last decades of the 20th-century, the ACT tertiary sector (including public services, defence, health care, and social assistance, but excluding retail and wholesale trade) account for almost 75% of its employment and economic value-add.[5]
Gross valued added by professional scientific and technical services in the ACT amounted to A$3.5 billion in 2017-18, or 8.7% of GSP,[6] and contributed to the employment of 22,214 persons in 2016.[32] Education and training also remained relevant, producing a GVA of A$2.3 billion in 2017-18, or 5.7% of GSP.[6] The balance of services employed 37,458 workers in 2016.
Exports and Imports
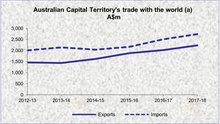
In 2017-18 total exports stood at A$2,230 million, while imports reached A$2,738 million, with a negative balance of trade of A$508 million. Services account for almost all exports (>99%) and imports (>90%) in the ACT. Since 2012-13, average annual goods and services exports growth has been 9.9%.[7]
ACT goods exports in 2017-18 have been conformed by coin, raw materials and fishery (A$21 million value), with Switzerland being the main destination. Manufactured products and other finished goods accounts conform most of goods imports (A$265 million value). Education-related services represented 44.2% of services exports, followed by public goods and services (22.5%) and personal travel (11.5%). Public goods and services accounted for a 57.5% share of services imports, while personal and business travel contributing 35.1%[7]
Services exports have grown by 22 percent since 2015, a notable industry growth in which the international education industry has played a major role. In 2016-17. There were approximately 17,000 international students in Canberra, reflecting an industry economic contribution of A$750 million per year. The ACT education industry has been enhanced by university investments and an active airline industry. By the same coin, tourism has also proved active, with projected economic contributions of $2.5 billion per year from 2020.[12]
Economic Policy
Budget
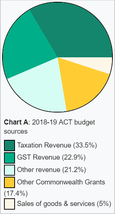
The 2018-19 ACT budget stood at A$5.7 billion, equivalent to $35,152 per household, and it was sourced as depicted in Chart A.[12] For the same financial year, the budget outlined a commitment of A$1.7 billion (29.8% of total) for healthcare services; A$1.3 billion (22.8%) for education; A$1.1 billion (19.3%) for justice, safety, and other community services; A$710 million (12.5%) for urban development and sustainability; A$438 million (7.7%) for public transport and other delivering services; and A$310 million (5.4%) for miscellaneous events, investment, and financial stewardship.[12]
Taxation
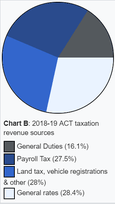
The taxation revenue component of the 2018-19 budget was composed as depicted in Chart B.[12]
In consideration of the large proportion of small and medium-sized business in the region, the payroll tax threshold was gradually increased from 1.5 million in 2012 to 2 million in 2016-17, the highest among all Australian jurisdictions. In accordance to the 2018-19 ACT Budget, such policy ensures that 91% of business are not required to file payroll tax. Small businesses and investment have also been stimulated since June 2017 by the introduction of a stamp-duty relief on commercial properties whose maximum value is A$1.5 million.[12][26]
See also
References
- ABS, Australian Bureau of Statistics (2018). "Australian National Accounts: State Accounts, 2017-18 'Table 1. Gross State Product, Chain volume measures and current prices', time series spreadsheet". Australian Bureau of Statistics. Retrieved 28 April 2019.
- ACT, Chief Ministry, Treasury and Economic Development (May 2019). "Economic Indicator Summary, ACT and Australia". ACT Economic Indicators. Retrieved 10 May 2019.
- ABS, Australian Capital Territory (2017). "Australian Capital Territory (STE) (8)". Australian Bureau of Statistics. Retrieved 11 May 2019.
- ABS, Australian Bureau of Statistics (2018). "5220.0 - Australian National Accounts: State Accounts, 2017-18 (Analysis of Results)". Australian Bureau of Statistics. Retrieved 17 May 2018.
- "Australian Capital Territory | Flag, Facts, Maps, & Points of Interest". Encyclopedia Britannica. Retrieved 2019-05-15.
- ACT, Chief Ministry, Treasury and Economic Development (2018). "Gross State Product – 2017-18". ACT Economic Indicators. Retrieved 10 May 2019.
- DFAT, Department of Foreign Affairs and Trade (2019). "Fact Sheet: ACT" (PDF). dfat.gov.au. Retrieved 28 May 2019.
- ACT, Chief Minister, Treasury and Economic Development (March 2019). "Labour Force - March 2019". ACT Economic Indicators. Retrieved 11 May 2019.
- ACT, Chief Minister, Treasury and Economic Development (December 2018). "Wage Price Index – December Quarter 2018". ACT Economic Indicators. Retrieved 11 May 2018.
- ABS, Australian Bureau of Statistics (2016). "2016 Census QuickStats". Australian Bureau of Statistics QuickStats. Retrieved 11 May 2019.
- ABS, Australian Bureau of Statistics (2018). "Australian National Accounts: State Accounts, 2017-18 'Table 19. Household Income Account and Per Capita, Australian Capital Territory: Current prices'". Australian Bureau of Statistics. Retrieved 28 April 2019.
- ACT, Chief Minister, Treasury and Economic Development Directorate (2018). ACT Budget 2018-19. Budget Paper 2: Budget in Brief (PDF). Canberra: Publishing Services. p. 10.
- ACT Government, Canberra Innovation Network. (2019). "Priority Investment Program". www.business.act.gov.au. Retrieved 27 May 2019.
- ABS, Australian Bureau of Statistics (2018). "Australian National Accounts: State Accounts, 2017-18 'Table 9. Expenditure, Income and Industry Components of Gross State Product, Australian Capital Territory, Chain volume measures and current prices'". Australian Bureau of Statistics. Retrieved 28 April 2019.
- EDA, Economic Development Australia (2018). "Output - Australian Capital Territory - Economic Development Australia – ACT". Economy Profile (EDA). Retrieved 2019-05-09.
- EDA, Economic Development Australia (April 2019). "Australian Capital Territory - Trends: Unemployment rate". EDA Economy Profile. Retrieved 11 May 2019.
- ACT, Chief Ministry, Treasury and Economic Development (March 2019). "Consumer Price Index (CPI) – March quarter 2019". ACT Economic Indicators. Retrieved 1 May 2019.
Through the year to the March quarter 2019, the primary contributor to price growth in the ACT was...
- ACT, Chief Minister, Treasury and Economic Development (November 2018). "Full-Time Adult Average Weekly Ordinary Time Earnings (AWOTE) – November 2018". ACT Economic Indicators. Retrieved 11 May 2019.
- ACT, Chief Minister, Treasury and Economic Development (March 2019). "ACT Residential Property Market, March 2019". ACT Economic Indicators. Retrieved 11 May 2019.
- RBA, Reserve Bank of Australia (2 April 2019). "Minutes of the Monetary Policy Meeting of the Reserve Bank Board". RBA - Monetary Policy, Minutes. Retrieved 11 May 2019.
- ACT, Chief Minister, Treasury and Economic Developement (2018). "Housing Affordability Report - December Quarter 2018". ACT Economic Indicators. p. 2. Retrieved 11 May 2019.
- ACT, Chief Minister, Treasury and Economic Development (December 2018). "Dwelling Unit Commencements ― December Quarter 2018". Retrieved 11 May 2019.
- EDA, Economic Development Australia - ACT (2018). "Australian Capital Territory - Building Approvals". EDA Economy Profile. Retrieved 11 May 2019.
- ACT, Chief Minister, Treasury and Economic Development (December 2018). "Construction Work Done – December Quarter 2018". ACT Economic Indicators. Retrieved 11 May 2019.
- EDA, Economic Development Australia - ACT (2018). "Business Counts (Turnover) - Australian Capital Territory". EDA Economy Profile. Retrieved 14 May 2019.
- "ACT lifts payroll tax threshold to $2 million: How the other states and territories stack up". SmartCompany. 2016-05-31. Retrieved 2019-05-27.
- ABARES, Department of Agriculture and Water Resources (2019). "About my region - Australian Capital Territory". ABARES: Research topics. Retrieved 14 May 2019.
- "The ACT economy still going strong | Dixon Advisory". www.dixon.com.au. Retrieved 2019-05-14.
- NAB Group Economics, National Australia Bank (2016). "State Update: Australian Capital Territory– January 2016" (PDF). NAB outlooks. Retrieved 15 May 2019.
- Access Economics Pty Limited, AE (2008). "The ACT and its region: economic relationships and key drivers of economic growth" (PDF). Chief Minister Department data. Retrieved 15 May 2019.
- "Canberra urged to 'hold its nerve' over public service cuts". ABC News. 2013-11-12. Retrieved 2019-05-15.
- EDA, Economic Development Australia - ACT (2019). "Australian Capital Territory - Employment by Industry". EDA Economy Profile. Retrieved 15 May 2019.
- Stanhope, Khalid Ahmed and Jon (2019-03-30). "The ACT government is shrinking health spending year on year". The Canberra Times. Retrieved 2019-05-15.