Demographics of the Dominican Republic
This article is about the demographic features of the population of the Dominican Republic, including population density, ethnicity, education level, health of the populace, economic status, religious affiliations and other aspects of the population.
| Year | Pop. | ±% |
|---|---|---|
| 1920 | 894,665 | — |
| 1935 | 1,479,417 | +65.4% |
| 1950 | 2,135,872 | +44.4% |
| 1960 | 3,047,070 | +42.7% |
| 1970 | 4,009,458 | +31.6% |
| 1981 | 5,545,741 | +38.3% |
| 1993 | 7,293,390 | +31.5% |
| 2002 | 8,562,541 | +17.4% |
| 2010 | 9,445,281 | +10.3% |
| 2017 | 10,169,172 | +7.7% |
| Source:[1] | ||
Population

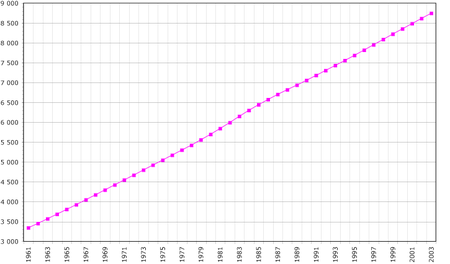
According to the 2019 revision of the World Population Prospects[2][3] the total population was 10,627,141 in 2018, compared to 2,380,000 in 1950. The proportion of the population aged below 15 in 2010 was 31.2%, 62.8% were aged between 15 and 65 years of age, while 6% were aged 65 years or older.[4]

| Total population (x 1000) |
Proportion aged 0–14 (%) |
Proportion aged 15–64 (%) |
Proportion aged 65+ (%) | |
|---|---|---|---|---|
| 1950 | 2 380 | 45.5 | 51.7 | 2.7 |
| 1955 | 2 796 | 46.3 | 51.1 | 2.6 |
| 1960 | 3 312 | 48.2 | 49.2 | 2.6 |
| 1965 | 3 900 | 48.9 | 48.5 | 2.6 |
| 1970 | 4 524 | 47.7 | 49.7 | 2.7 |
| 1975 | 5 169 | 45.3 | 51.9 | 2.8 |
| 1980 | 5 826 | 42.6 | 54.4 | 3.1 |
| 1985 | 6 524 | 40.4 | 56.2 | 3.4 |
| 1990 | 7 245 | 38.5 | 57.6 | 3.9 |
| 1995 | 7 978 | 37.0 | 58.5 | 4.5 |
| 2000 | 8 663 | 34.9 | 59.9 | 5.1 |
| 2005 | 9 343 | 33.1 | 61.3 | 5.7 |
| 2010 | 10 017 | 31.2 | 62.8 | 6.0 |
| 2015 | 10 528 | 30.0 | 63.4 | 6.7 |
| 2020 | 11 107 | 28.3 | 62.8 | 7.6 |
Vital statistics
UN estimates
Registration of vital events is not universal in the Dominican Republic. The Population Departement of the United Nations prepared the following estimates: [4]
| Period | Live births per year |
Deaths per year |
Natural change per year |
CBR* | CDR* | NC* | TFR* | IMR* | Life expectancy total |
Life expectancy males |
Life expectancy females |
|---|---|---|---|---|---|---|---|---|---|---|---|
| 1950–1955 | 140 000 | 53 000 | 87 000 | 54.3 | 20.5 | 33.8 | 7.60 | 153 | 46.0 | 44.7 | 47.3 |
| 1955–1960 | 163 000 | 54 000 | 109 000 | 53.4 | 17.6 | 35.8 | 7.64 | 139 | 49.9 | 48.6 | 51.4 |
| 1960–1965 | 178 000 | 52 000 | 126 000 | 49.5 | 14.5 | 35.0 | 7.35 | 124 | 53.6 | 52.1 | 55.2 |
| 1965–1970 | 186 000 | 50 000 | 136 000 | 44.2 | 11.8 | 32.3 | 6.65 | 109 | 56.9 | 55.4 | 58.7 |
| 1970–1975 | 190 000 | 47 000 | 143 000 | 39.2 | 9.7 | 29.6 | 5.68 | 96 | 59.8 | 58.1 | 61.8 |
| 1975–1980 | 194 000 | 46 000 | 149 000 | 35.4 | 8.3 | 27.1 | 4.76 | 86 | 62.0 | 60.3 | 64.0 |
| 1980–1985 | 206 000 | 46 000 | 160 000 | 33.4 | 7.5 | 25.9 | 4.15 | 75 | 64.0 | 62.1 | 66.1 |
| 1985–1990 | 213 000 | 46 000 | 168 000 | 31.0 | 6.7 | 24.3 | 3.65 | 63 | 66.5 | 64.3 | 69.0 |
| 1990–1995 | 218 000 | 46 000 | 172 000 | 28.7 | 6.0 | 22.7 | 3.31 | 48 | 69.0 | 66.5 | 71.9 |
| 1995–2000 | 215 000 | 50 000 | 165 000 | 25.8 | 6.0 | 19.8 | 2.98 | 41 | 70.0 | 67.3 | 73.1 |
| 2000–2005 | 219 000 | 54 000 | 165 000 | 23.8 | 6.1 | 17.7 | 2.75 | 35 | 71.1 | 68.1 | 74.4 |
| 2005–2010 | 221 000 | 58 000 | 163 000 | 22.0 | 6.0 | 16.0 | 2.57 | 30 | 72.2 | 69.2 | 75.5 |
| 2010–2015 | 20.9 | 6.1 | 14.8 | 2.57 | |||||||
| 2015–2020 | 19.7 | 6.1 | 13.6 | 2.45 | |||||||
| 2020–2025 | 18.0 | 6.4 | 11.6 | 2.36 | |||||||
| 2025–2030 | 16.5 | 6.7 | 9.8 | 2.23 | |||||||
| 2030–2035 | 15.2 | 7.1 | 8.1 | 2.12 | |||||||
| 2035–2040 | 14.2 | 7.5 | 6.7 | 2.03 | |||||||
| * CBR = crude birth rate (per 1000); CDR = crude death rate (per 1000); NC = natural change (per 1000); IMR = infant mortality rate per 1000 births; TFR = total fertility rate (number of children per woman) | |||||||||||
Births and deaths
| Year | Population | Live births | Deaths | Natural increase | Crude birth rate | Crude death rate | Rate of natural increase | TFR | |||||||||||||||||||||||||||||||||||||||||||||||||||||||||||||||||||||||||||||||||||||||||||||||||||||||||||||||||||||||||||||||||||||||||||||||||||||||||||||||||||||||||||||||||||||||||||||||||||||||||||||||||||||||||||||||||||||||||||||||||||||||||||||||||||||||||||||||||||||||||||||||
|---|---|---|---|---|---|---|---|---|---|---|---|---|---|---|---|---|---|---|---|---|---|---|---|---|---|---|---|---|---|---|---|---|---|---|---|---|---|---|---|---|---|---|---|---|---|---|---|---|---|---|---|---|---|---|---|---|---|---|---|---|---|---|---|---|---|---|---|---|---|---|---|---|---|---|---|---|---|---|---|---|---|---|---|---|---|---|---|---|---|---|---|---|---|---|---|---|---|---|---|---|---|---|---|---|---|---|---|---|---|---|---|---|---|---|---|---|---|---|---|---|---|---|---|---|---|---|---|---|---|---|---|---|---|---|---|---|---|---|---|---|---|---|---|---|---|---|---|---|---|---|---|---|---|---|---|---|---|---|---|---|---|---|---|---|---|---|---|---|---|---|---|---|---|---|---|---|---|---|---|---|---|---|---|---|---|---|---|---|---|---|---|---|---|---|---|---|---|---|---|---|---|---|---|---|---|---|---|---|---|---|---|---|---|---|---|---|---|---|---|---|---|---|---|---|---|---|---|---|---|---|---|---|---|---|---|---|---|---|---|---|---|---|---|---|---|---|---|---|---|---|---|---|---|---|---|---|---|---|---|---|---|---|---|---|---|---|---|---|---|---|---|---|---|---|---|---|---|---|---|---|---|---|---|---|---|---|---|---|---|---|---|---|---|---|---|
| 2001 | 192,677 | 28,557 | 164,120 | ||||||||||||||||||||||||||||||||||||||||||||||||||||||||||||||||||||||||||||||||||||||||||||||||||||||||||||||||||||||||||||||||||||||||||||||||||||||||||||||||||||||||||||||||||||||||||||||||||||||||||||||||||||||||||||||||||||||||||||||||||||||||||||||||||||||||||||||||||||||||||||||||||||
| 2002 | 189,704 | 26,525 | 163,179 | ||||||||||||||||||||||||||||||||||||||||||||||||||||||||||||||||||||||||||||||||||||||||||||||||||||||||||||||||||||||||||||||||||||||||||||||||||||||||||||||||||||||||||||||||||||||||||||||||||||||||||||||||||||||||||||||||||||||||||||||||||||||||||||||||||||||||||||||||||||||||||||||||||||
| 2003 | 175,811 | 29,735 | 146,076 | ||||||||||||||||||||||||||||||||||||||||||||||||||||||||||||||||||||||||||||||||||||||||||||||||||||||||||||||||||||||||||||||||||||||||||||||||||||||||||||||||||||||||||||||||||||||||||||||||||||||||||||||||||||||||||||||||||||||||||||||||||||||||||||||||||||||||||||||||||||||||||||||||||||
| 2004 | 166,401 | 34,400 | 132,001 | ||||||||||||||||||||||||||||||||||||||||||||||||||||||||||||||||||||||||||||||||||||||||||||||||||||||||||||||||||||||||||||||||||||||||||||||||||||||||||||||||||||||||||||||||||||||||||||||||||||||||||||||||||||||||||||||||||||||||||||||||||||||||||||||||||||||||||||||||||||||||||||||||||||
| 2005 | 163,433 | 34,270 | 129,163 | ||||||||||||||||||||||||||||||||||||||||||||||||||||||||||||||||||||||||||||||||||||||||||||||||||||||||||||||||||||||||||||||||||||||||||||||||||||||||||||||||||||||||||||||||||||||||||||||||||||||||||||||||||||||||||||||||||||||||||||||||||||||||||||||||||||||||||||||||||||||||||||||||||||
| 2006 | 155,501 | 32,259 | 123,242 | ||||||||||||||||||||||||||||||||||||||||||||||||||||||||||||||||||||||||||||||||||||||||||||||||||||||||||||||||||||||||||||||||||||||||||||||||||||||||||||||||||||||||||||||||||||||||||||||||||||||||||||||||||||||||||||||||||||||||||||||||||||||||||||||||||||||||||||||||||||||||||||||||||||
| 2007 | 153,814 | 33,822 | 119,992 | ||||||||||||||||||||||||||||||||||||||||||||||||||||||||||||||||||||||||||||||||||||||||||||||||||||||||||||||||||||||||||||||||||||||||||||||||||||||||||||||||||||||||||||||||||||||||||||||||||||||||||||||||||||||||||||||||||||||||||||||||||||||||||||||||||||||||||||||||||||||||||||||||||||
| 2008 | 160,578 | 33,865 | 126,713 | ||||||||||||||||||||||||||||||||||||||||||||||||||||||||||||||||||||||||||||||||||||||||||||||||||||||||||||||||||||||||||||||||||||||||||||||||||||||||||||||||||||||||||||||||||||||||||||||||||||||||||||||||||||||||||||||||||||||||||||||||||||||||||||||||||||||||||||||||||||||||||||||||||||
| 2009 | 164,306 | 33,749 | 130,557 | 2.516 | |||||||||||||||||||||||||||||||||||||||||||||||||||||||||||||||||||||||||||||||||||||||||||||||||||||||||||||||||||||||||||||||||||||||||||||||||||||||||||||||||||||||||||||||||||||||||||||||||||||||||||||||||||||||||||||||||||||||||||||||||||||||||||||||||||||||||||||||||||||||||||||||||||
| 2010 | 9,445,281 | 166,195 | 36,438 | 129,757 | 17,59 | 3,86 | 13,73 | 2.491 | |||||||||||||||||||||||||||||||||||||||||||||||||||||||||||||||||||||||||||||||||||||||||||||||||||||||||||||||||||||||||||||||||||||||||||||||||||||||||||||||||||||||||||||||||||||||||||||||||||||||||||||||||||||||||||||||||||||||||||||||||||||||||||||||||||||||||||||||||||||||||||||||
| 2011 | 172,514 | 36,054 | 136,460 | 2.440 | |||||||||||||||||||||||||||||||||||||||||||||||||||||||||||||||||||||||||||||||||||||||||||||||||||||||||||||||||||||||||||||||||||||||||||||||||||||||||||||||||||||||||||||||||||||||||||||||||||||||||||||||||||||||||||||||||||||||||||||||||||||||||||||||||||||||||||||||||||||||||||||||||||
| 2012 | 165,991 | 36,266 | 129,725 | 2.418 | |||||||||||||||||||||||||||||||||||||||||||||||||||||||||||||||||||||||||||||||||||||||||||||||||||||||||||||||||||||||||||||||||||||||||||||||||||||||||||||||||||||||||||||||||||||||||||||||||||||||||||||||||||||||||||||||||||||||||||||||||||||||||||||||||||||||||||||||||||||||||||||||||||
| 2013 | 166,919 | 36,326 | 130,593 | 2.391 | |||||||||||||||||||||||||||||||||||||||||||||||||||||||||||||||||||||||||||||||||||||||||||||||||||||||||||||||||||||||||||||||||||||||||||||||||||||||||||||||||||||||||||||||||||||||||||||||||||||||||||||||||||||||||||||||||||||||||||||||||||||||||||||||||||||||||||||||||||||||||||||||||||
| 2014 | 169,107 | 40,896 | 128,211 | 2.364 | |||||||||||||||||||||||||||||||||||||||||||||||||||||||||||||||||||||||||||||||||||||||||||||||||||||||||||||||||||||||||||||||||||||||||||||||||||||||||||||||||||||||||||||||||||||||||||||||||||||||||||||||||||||||||||||||||||||||||||||||||||||||||||||||||||||||||||||||||||||||||||||||||||
| 2015 | 164,843 | 41,428 | 123,415 | 2.34 | |||||||||||||||||||||||||||||||||||||||||||||||||||||||||||||||||||||||||||||||||||||||||||||||||||||||||||||||||||||||||||||||||||||||||||||||||||||||||||||||||||||||||||||||||||||||||||||||||||||||||||||||||||||||||||||||||||||||||||||||||||||||||||||||||||||||||||||||||||||||||||||||||||
| 2016 | 155,883 | 43,633 | 112,250 | 2.31 | |||||||||||||||||||||||||||||||||||||||||||||||||||||||||||||||||||||||||||||||||||||||||||||||||||||||||||||||||||||||||||||||||||||||||||||||||||||||||||||||||||||||||||||||||||||||||||||||||||||||||||||||||||||||||||||||||||||||||||||||||||||||||||||||||||||||||||||||||||||||||||||||||||
| 2017 | 162,139 | 42,580 | 119,559 | ||||||||||||||||||||||||||||||||||||||||||||||||||||||||||||||||||||||||||||||||||||||||||||||||||||||||||||||||||||||||||||||||||||||||||||||||||||||||||||||||||||||||||||||||||||||||||||||||||||||||||||||||||||||||||||||||||||||||||||||||||||||||||||||||||||||||||||||||||||||||||||||||||||
| 2018 | 159,532 | 40,440 | 119,092 | ||||||||||||||||||||||||||||||||||||||||||||||||||||||||||||||||||||||||||||||||||||||||||||||||||||||||||||||||||||||||||||||||||||||||||||||||||||||||||||||||||||||||||||||||||||||||||||||||||||||||||||||||||||||||||||||||||||||||||||||||||||||||||||||||||||||||||||||||||||||||||||||||||||
| 2019 | 167,686 | 42,811 | 124,875 | ≈ | |||||||||||||||||||||||||||||||||||||||||||||||||||||||||||||||||||||||||||||||||||||||||||||||||||||||||||||||||||||||||||||||||||||||||||||||||||||||||||||||||||||||||||||||||||||||||||||||||||||||||||||||||||||||||||||||||||||||||||||||||||||||||||||||||||||||||||||||||||||||||||||||||||
| 2020 | 10,857,388
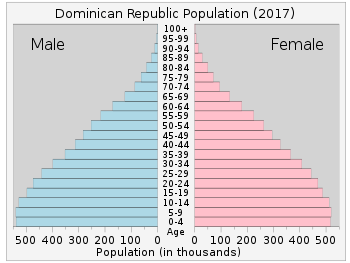
Structure of the population [7]Structure of the population (01.07.2017) (Estimates) :
Structure of the population (DHS 2013) (Males 19 686, Females 19 878 = 39 564) :
Fertility and birthsTotal Fertility Rate (TFR) (Wanted Fertility Rate) and Crude Birth Rate (CBR):[8]
Other demographic statisticsDemographic statistics according to the World Population Review in 2019.[9]
Demographic statistics according to the CIA World Factbook, unless otherwise indicated.[10]
 Population pyramid of Dominican Republic in 2017
definition: age 15 and over can read and write (2016 est.)
Unemployment, youth ages 15–24:
See also
References
|
