Demographics of Guatemala
The demographics of Guatemala are diverse; the population, 14,901,286 strong, (2018 census)[1] historically comprises primarily of Mestizos (60%), then Amerindians (30%) and people of European descent (10%). The population is divided almost evenly between rural and urban areas.[2]
| Year | Pop. | ±% |
|---|---|---|
| 1778 | 396,149 | — |
| 1880 | 1,224,602 | +209.1% |
| 1893 | 1,364,678 | +11.4% |
| 1921 | 2,004,900 | +46.9% |
| 1940 | 2,400,000 | +19.7% |
| 1950 | 2,790,868 | +16.3% |
| 1964 | 4,287,997 | +53.6% |
| 1973 | 5,160,221 | +20.3% |
| 1981 | 6,054,227 | +17.3% |
| 1994 | 8,331,874 | +37.6% |
| 2002 | 11,237,196 | +34.9% |
| 2018 | 14,901,286 | +32.6% |
| Source: [3] [4] | ||
About 65% of the population speak Spanish, with nearly all the rest speaking indigenous languages (there are 23 officially recognized indigenous languages).[5]
According to the 2018 census, 43.56% of the population is Indigenous including 41.66% Mayan, 1.77% Xinca, and 0.13% Garifuna (Mixed African and indigenous).[6]
Population
According to the 2019 revision of the World Population Prospects[8][9] the total population estimate was 17,247,849 in 2018. The proportion of the population below the age of 15 in 2010 was 41.5%, 54.1% were aged between 15 and 65 years of age, and 4.4% were aged 65 years or older.[7]
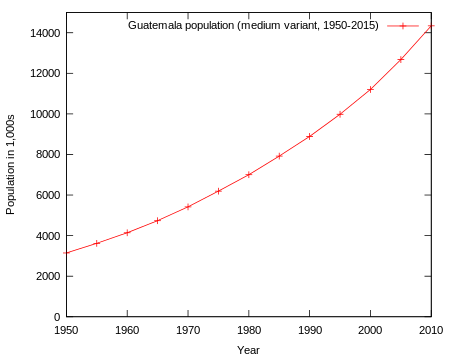
Guatemala City is home to almost 3 million inhabitants.[10] In 1900 Guatemala had a population of 885,000.[11] Over the twentifirst century Guatemala's population grew by a factor of fourteen. Even though Guatemala's population grew by a factor of 14, it still wasn't the biggest jump in that region.[12] Although Guatemala does have an increase in population, the annual population isn't the superior in that region of the world as well.[12]
| Total population (x 1000) |
Proportion aged 0–14 (%) |
Proportion aged 15–64 (%) |
Proportion aged 65+ (%) | |
|---|---|---|---|---|
| 1950 | 3 146 | 44.6 | 52.9 | 2.5 |
| 1955 | 3 619 | 45.4 | 52.0 | 2.6 |
| 1960 | 4 141 | 45.8 | 51.6 | 2.7 |
| 1965 | 4 736 | 45.2 | 52.0 | 2.8 |
| 1970 | 5 416 | 44.6 | 52.5 | 2.9 |
| 1975 | 6 194 | 44.8 | 52.3 | 2.9 |
| 1980 | 7 001 | 45.4 | 51.6 | 3.0 |
| 1985 | 7 920 | 45.7 | 51.2 | 3.1 |
| 1990 | 8 890 | 45.4 | 51.3 | 3.4 |
| 1995 | 9 984 | 44.9 | 51.4 | 3.7 |
| 2000 | 11 204 | 44.1 | 51.9 | 4.0 |
| 2005 | 12 679 | 43.2 | 52.6 | 4.3 |
| 2010 | 14 342 | 41.5 | 54.1 | 4.4 |
Population by departments
In Guatemala, there are 22 departments that make up the country. Each department has its own population, with Guatemala City ranking at 1 with the highest population and El Progreso ranking at 22 with the lowest population.[13]
| Rank | Department | Pop. | Rank | Department | Pop. |
| 1 | Guatemala | 3,306,397 | 12 | Jutiapa | 489,085 |
| 2 | Huehuetenango | 1,234,593 | 13 | Izabal | 445,125 |
| 3 | Alta Verapaz | 1,219,585 | 14 | Chiquimula | 397,202 |
| 4 | San Marcos | 1,095,997 | 15 | Santa Rosa | 367,569 |
| 5 | Quiché | 955,705 | 16 | Jalapa | 345,926 |
| 6 | Quetzaltenango | 844,906 | 17 | Sacatepéquez | 336,606 |
| 7 | Escuintla | 746,309 | 18 | Retalhuleu | 325,556 |
| 8 | Petén | 711,585 | 19 | Baja Verapaz | 291,903 |
| 9 | Chimaltenango | 666,938 | 20 | Zacapa | 291,903 |
| 10 | Suchitepéquez | 555,261 | 21 | Totonicapán | 134,373 |
| 11 | Sololá | 430,573 | 22 | El Progreso | 22,654 |
| Overall Total: 15,806,675 (2014) | |||||
| Source: National Institute of Statistics (INE)[14] | |||||
According to the table, Guatemala City accounts for 20% of the entire population in Guatemala, while El Progreso only accounts for 0.14% of the population. Sololá accounts for 2.7% of the population while ranking in the middle at 11. Overall, the rankings correlate to the percent of the population that each department contains.
Emigration
The Guatemalan civil war from 1960 to 1996 led to mass emigration, particularly Guatemalan immigration to the United States. According to the International Organization for Migration, the total number of emigrants increased from 6,700 in the 1960s to 558,776 for the period 1995-2000; by 2005, the total number had reached 1.3 million.[15] In 2013, the Migration Policy Institute (MPI) estimated that there were about 900,000 Guatemalan Americans (persons of Guatemalan origin in the United States).[16]
| Country | Count |
|---|---|
| 480,665[17] – 1,489,426[18] | |
| 23,529[18] | |
| 14,693[18] | |
| 14,256[18] – 34,665[19] | |
| 5,989[18] | |
| 5,172[18] | |
| 4,209[18] | |
| 2,491[18] |
Ethnic groups
Official 2012 statistics indicate that approximately 60.2% of the population is "non-Indigenous",[2] referring to the Mestizo population and the people of European origin. These people are called Ladino in Guatemala.
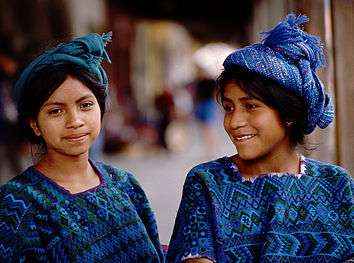
Approximately 39.8% of the population is Indigenous[2] and consist of 23 Maya groups and one non-Maya group. These are divided as follows: (K'iche 9.1%, 8.4% Kaqchikel, Mam 7.9%, 6.3% Q'eqchi', other Maya peoples 8.6%, 0.2% Indigenous non-Maya).[5] They live all over the country, especially in the highlands.
Other racial groups include numbers of Afro-Guatemalans, Afro-Mestizos, and Garifuna of mixed African and Indigenous Caribbean origins who live in the country's eastern end. Some Garifunas live mainly in Livingston, San Vicente and Puerto Barrios. They descend mainly from the Arawaks and Belizean Creoles.[5]
There are thousands of Arab Guatemalans descending from; Palestine, Syria, Jordan, Iraq, and other Arab countries who reside in Guatemala City. Some belong to Christian Churches while others to Islamic Mosques.
There are also thousands of Jews residing in Guatemala. They are immigrants from Germany and Eastern Europe that arrived in the 19th century. Many immigrated during World War II. There are approximately 9,000 Jews living in Guatemala today. Most live in Guatemala City, Quezaltenango and San Marcos. Today, the Jewish community in Guatemala is made up of Orthodox Jews, Sephardi, Eastern European and German Jews.
In 2014, numerous members of the Hassidic communities Lev Tahor and Toiras Jesed began settling in the village of San Juan La Laguna. The mainstream Jewish community was reportedly dismayed and concerned that the arrival of communities with a more visible adherence to Judaism might stir up anti-Jewish sentiment. Despite the tropical heat, the members of the community continued to wear the traditional ancient Jewish clothing.[21][22][23]
Asian Guatemalans are primarily of Korean descent[24] and Chinese descent, whose ancestors were farm workers and railroad laborers in the early 20th century.
History
The Maya Civilization ruled Guatemala and the surrounding regions until around 1,000 A.D. Following 1,000 A.D., Guatemala became a Spanish colony for approximately three centuries, until in 1821 when Guatemala won its independence. Since the independence of Guatemala, the country has experienced a wide range of governments, including civilian and military governments. In 1996, a peace treaty was signed by the government that ended internal conflicts within the region, which caused over 200,000 casualties and approximately one million refugees.[25]
White Guatemalans
Approximately 18.5% of the population is considered White or Caucasian, which accounts for more than 3 million of the population. Most are of Spanish, German and Italian descent, but there is a considerable number of people of Belgian, French, British, Swiss, Finnish, Russian and Hungarian descent.
The departments of Zacapa and Chiquimula are half or predominantly of Spanish descent, while castizos, the white population, make up more than 80% in these departments, where many European immigrants arrived, mainly during the 19th and 20th centuries. In Guatemala City there is a significant amount of minority descendants of Europeans (35-40%), and other minorities with more than 20% in Cobán and Xelajú.
Mestizo Guatemalans
Guatemalan Mestizos are people of mixed European and indigenous ancestry. The Mestizo population is heavily populated in urban areas of the country (the national capital and departmental capitals).[26]
Historically, the Mestizo population in the Kingdom of Guatemala at the time of Independence amounted to nearly 600,000 Indians, 300,000 Castas (mostly Mestizos and a lesser number of Mulattos, Zambos, and Pardos), and 45,000 Criollos or Spanish, with a very small number of Spaniards.[27]
Indigenous Guatemalans
The Amerindian populations in Guatemala include the K'iche' 9.1%, Kaqchikel 8.4%, Mam 7.9% and Q'eqchi 6.3%. 8.6% belongs to other Maya groups, 0.4% belong to non-Maya Indigenous peoples. The whole Indigenous community in Guatemala is about 40.5% of the population according to the census, but in reality, the Mayan population is much higher, with estimates ranging from 60% to 80% of the country's population, since many Mayans in Guatemala are culturally Mestizo.[28]
Vital statistics
UN estimates
The Population Department of the United Nations prepared the following estimates.[7]
| Period | Live births per year |
Deaths per year |
Natural change per year |
CBR* | CDR* | NC* | TFR* | IMR* | Life expectancy total |
Life expectancy males |
Life expectancy females |
|---|---|---|---|---|---|---|---|---|---|---|---|
| 1950-1955 | 170 000 | 75 000 | 95 000 | 50.3 | 22.3 | 28.0 | 7.00 | 141 | 42.5 | 41.8 | 43.3 |
| 1955-1960 | 183 000 | 78 000 | 104 000 | 47.0 | 20.2 | 26.9 | 6.60 | 134 | 44.5 | 43.7 | 45.4 |
| 1960-1965 | 204 000 | 80 000 | 124 000 | 46.0 | 18.0 | 28.0 | 6.50 | 127 | 47.1 | 46.2 | 48.1 |
| 1965-1970 | 227 000 | 80 000 | 146 000 | 44.7 | 15.8 | 28.8 | 6.30 | 116 | 50.1 | 49.0 | 51.3 |
| 1970-1975 | 255 000 | 79 000 | 177 000 | 44.0 | 13.5 | 30.4 | 6.20 | 102 | 53.9 | 52.4 | 55.4 |
| 1975-1980 | 287 000 | 80 000 | 206 000 | 43.5 | 12.2 | 31.3 | 6.20 | 91 | 56.2 | 54.4 | 58.2 |
| 1980-1985 | 315 000 | 81 000 | 234 000 | 42.2 | 10.9 | 31.3 | 6.10 | 79 | 58.3 | 56.1 | 60.8 |
| 1985-1990 | 333 000 | 79 000 | 254 000 | 39.6 | 9.4 | 30.2 | 5.70 | 67 | 60.9 | 58.3 | 63.8 |
| 1990-1995 | 367 000 | 76 000 | 291 000 | 38.9 | 8.1 | 30.8 | 5.45 | 55 | 63.5 | 60.5 | 66.9 |
| 1995-2000 | 396 000 | 73 000 | 322 000 | 37.3 | 6.9 | 30.4 | 5.00 | 46 | 66.3 | 62.9 | 70.0 |
| 2000-2005 | 427 000 | 72 000 | 355 000 | 35.8 | 6.1 | 29.7 | 4.60 | 39 | 69.0 | 65.5 | 72.5 |
| 2005-2010 | 449 000 | 77 000 | 373 000 | 33.3 | 5.7 | 27.6 | 4.15 | 30 | 70.3 | 66.7 | 73.8 |
| * CBR = crude birth rate (per 1000); CDR = crude death rate (per 1000); NC = natural change (per 1000); IMR = infant mortality rate per 1000 births; TFR = total fertility rate (number of children per woman) | |||||||||||
Vital statistics
| Average population | Live births | Deaths | Natural change | Crude birth rate(per 1,000) | Death rate (per 1,000) | Natural change (per 1,000) | Fertility rate | |
|---|---|---|---|---|---|---|---|---|
| 1930 | 1,760,000 | 100,000 | 43,500 | 56,500 | 56.8 | 24.7 | 32.1 | |
| 1931 | 1,810,000 | 99,000 | 44,000 | 55,000 | 54.7 | 24.3 | 30.4 | |
| 1932 | 1,860,000 | 93,600 | 43,900 | 49,700 | 50.3 | 23.6 | 26.7 | |
| 1933 | 1,910,000 | 90,700 | 52,100 | 38,600 | 47.5 | 27.3 | 20.2 | |
| 1934 | 1,940,000 | 92,205 | 60,051 | 32,154 | 47.5 | 31.0 | 16.6 | |
| 1935 | 1,980,000 | 96,031 | 54,789 | 41,242 | 48.5 | 27.7 | 20.8 | |
| 1936 | 2,020,000 | 97,646 | 50,604 | 47,042 | 48.3 | 25.1 | 23.3 | |
| 1937 | 2,070,000 | 96,981 | 51,027 | 45,954 | 46.9 | 24.7 | 22.2 | |
| 1938 | 2,110,000 | 98,906 | 56,131 | 42,775 | 46.9 | 26.6 | 20.3 | |
| 1939 | 2,150,000 | 102,908 | 64,117 | 38,791 | 47.9 | 29.8 | 18.0 | |
| 1940 | 2,200,000 | 106,998 | 55,083 | 51,915 | 48.6 | 25.0 | 23.6 | |
| 1941 | 2,250,000 | 103,688 | 56,444 | 47,244 | 46.1 | 25.1 | 21.0 | |
| 1942 | 2,300,000 | 107,519 | 72,477 | 35,042 | 46.7 | 31.5 | 15.2 | |
| 1943 | 2,340,000 | 112,407 | 72,837 | 39,570 | 48.0 | 31.1 | 16.9 | |
| 1944 | 2,390,000 | 111,324 | 63,068 | 48,256 | 46.6 | 26.4 | 20.2 | |
| 1945 | 2,440,000 | 118,912 | 59,732 | 59,180 | 48.7 | 24.5 | 24.3 | |
| 1946 | 2,500,000 | 120,525 | 61,641 | 58,884 | 48.2 | 24.7 | 23.6 | |
| 1947 | 2,570,000 | 134,066 | 63,316 | 70,750 | 52.2 | 24.6 | 27.5 | |
| 1948 | 2,641,000 | 137,009 | 62,090 | 74,919 | 51.9 | 23.5 | 28.4 | |
| 1949 | 2,724,000 | 140,596 | 59,277 | 81,319 | 51.6 | 21.8 | 29.9 | |
| 1950 | 3,146,000 | 142,673 | 61,234 | 81,439 | 48.1 | 20.6 | 27.4 | |
| 1951 | 3,238,000 | 151,416 | 56,550 | 94,866 | 49.6 | 18.5 | 31.1 | |
| 1952 | 3,331,000 | 151,865 | 71,994 | 79,871 | 48.3 | 22.9 | 25.4 | |
| 1953 | 3,426,000 | 156,377 | 70,794 | 85,583 | 48.3 | 21.9 | 26.4 | |
| 1954 | 3,521,000 | 162,773 | 58,132 | 104,641 | 48.9 | 17.4 | 31.4 | |
| 1955 | 3,619,000 | 158,856 | 67,088 | 91,768 | 46.3 | 19.6 | 26.7 | |
| 1956 | 3,719,000 | 163,301 | 66,280 | 97,021 | 46.2 | 18.8 | 27.5 | |
| 1957 | 3,820,000 | 170,381 | 70,933 | 99,448 | 46.9 | 19.5 | 27.4 | |
| 1958 | 3,924,000 | 172,745 | 75,634 | 97,111 | 46.2 | 20.2 | 26.0 | |
| 1959 | 4,031,000 | 181,740 | 63,010 | 118,730 | 47.2 | 16.4 | 30.8 | |
| 1960 | 4,141,000 | 186,476 | 65,805 | 120,671 | 47.1 | 16.6 | 30.4 | |
| 1961 | 4,253,000 | 193,833 | 63,287 | 130,546 | 47.5 | 15.5 | 32.0 | |
| 1962 | 4,369,000 | 191,420 | 69,287 | 122,133 | 45.6 | 16.5 | 29.1 | |
| 1963 | 4,488,000 | 197,671 | 71,449 | 126,222 | 45.8 | 16.6 | 29.2 | |
| 1964 | 4,610,000 | 196,386 | 68,278 | 128,108 | 44.2 | 15.4 | 28.9 | |
| 1965 | 4,736,000 | 201,059 | 74,830 | 126,229 | 44.0 | 16.4 | 27.6 | |
| 1966 | 4,864,000 | 206,520 | 75,774 | 130,746 | 44.0 | 16.1 | 27.8 | |
| 1967 | 4,996,000 | 201,816 | 71,191 | 130,625 | 41.8 | 14.8 | 27.1 | |
| 1968 | 5,132,000 | 211,679 | 79,421 | 132,258 | 42.7 | 16.0 | 26.7 | |
| 1969 | 5,271,000 | 215,397 | 85,174 | 130,223 | 42.2 | 16.7 | 25.5 | |
| 1970 | 5,416,000 | 212,151 | 77,333 | 134,818 | 40.5 | 14.7 | 25.7 | |
| 1971 | 5,565,000 | 229,674 | 75,223 | 154,451 | 42.6 | 14.0 | 28.6 | |
| 1972 | 5,719,000 | 241,593 | 67,989 | 173,604 | 43.6 | 12.3 | 31.3 | |
| 1973 | 5,877,000 | 238,498 | 69,454 | 169,044 | 41.8 | 12.2 | 29.6 | |
| 1974 | 6,036,000 | 252,203 | 69,820 | 182,383 | 43.0 | 11.9 | 31.1 | |
| 1975 | 6,194,000 | 249,332 | 78,708 | 170,624 | 41.4 | 13.1 | 28.4 | |
| 1976 | 6,352,000 | 266,728 | 81,627 | 185,101 | 43.2 | 13.2 | 30.0 | |
| 1977 | 6,510,000 | 284,747 | 71,777 | 212,970 | 45.0 | 11.3 | 33.6 | |
| 1978 | 6,669,000 | 286,415 | 66,844 | 219,571 | 44.1 | 10.3 | 33.8 | |
| 1979 | 6,832,000 | 295,972 | 72,274 | 223,698 | 44.5 | 10.9 | 33.6 | |
| 1980 | 7,001,000 | 303,643 | 71,352 | 232,291 | 44.5 | 10.5 | 34.1 | |
| 1981 | 7,177,000 | 308,413 | 75,658 | 232,755 | 44.1 | 10.8 | 33.3 | |
| 1982 | 7,358,000 | 312,047 | 76,267 | 235,780 | 43.5 | 10.6 | 32.9 | |
| 1983 | 7,543,000 | 306,827 | 74,462 | 232,365 | 41.7 | 10.1 | 31.6 | |
| 1984 | 7,731,000 | 312,094 | 75,462 | 236,632 | 41.3 | 10.0 | 31.4 | |
| 1985 | 7,920,000 | 326,849 | 69,455 | 257,394 | 42.2 | 9.0 | 33.3 | |
| 1986 | 8,109,000 | 318,340 | 66,328 | 252,012 | 40.1 | 8.4 | 31.8 | |
| 1987 | 8,299,000 | 319,942 | 66,404 | 253,538 | 39.4 | 8.2 | 31.2 | |
| 1988 | 8,492,000 | 337,396 | 64,100 | 273,296 | 40.5 | 7.7 | 32.8 | |
| 1989 | 8,688,000 | 340,807 | 61,548 | 279,259 | 39.9 | 7.2 | 32.7 | |
| 1990 | 8,890,000 | 347,207 | 73,344 | 273,863 | 39.7 | 8.4 | 31.3 | |
| 1991 | 9,099,000 | 359,904 | 72,896 | 287,008 | 39.6 | 8.0 | 31.5 | |
| 1992 | 9,313,000 | 363,648 | 73,124 | 290,524 | 39.0 | 7.9 | 31.2 | |
| 1993 | 9,533,000 | 370,138 | 73,870 | 296,268 | 38.8 | 7.7 | 31.1 | |
| 1994 | 9,756,000 | 381,497 | 74,761 | 306,736 | 39.1 | 7.7 | 31.4 | |
| 1995 | 9,984,000 | 371,091 | 65,159 | 305,932 | 37.2 | 6.5 | 30.6 | |
| 1996 | 10,215,000 | 377,723 | 60,618 | 317,105 | 37.0 | 5.9 | 31.0 | |
| 1997 | 10,450,000 | 387,862 | 67,691 | 320,171 | 37.1 | 6.5 | 30.6 | |
| 1998 | 10,691,000 | 400,133 | 69,847 | 330,286 | 37.4 | 6.5 | 30.9 | |
| 1999 | 10,942,000 | 409,034 | 65,139 | 343,895 | 37.4 | 6.0 | 31.4 | |
| 2000 | 11,204,000 | 425,410 | 67,284 | 358,126 | 38.0 | 6.0 | 32.0 | |
| 2001 | 11,479,000 | 415,338 | 68,041 | 347,297 | 36.2 | 5.9 | 30.3 | |
| 2002 | 11,766,000 | 387,287 | 66,089 | 321,198 | 32.9 | 5.6 | 27.3 | |
| 2003 | 12,063,000 | 375,092 | 66,695 | 308,397 | 31.1 | 5.5 | 25.6 | |
| 2004 | 12,368,000 | 383,704 | 66,991 | 316,713 | 31.0 | 5.4 | 25.6 | |
| 2005 | 12,679,000 | 374,066 | 71,039 | 303,027 | 29.5 | 5.6 | 23.9 | 3.796 |
| 2006 | 12,995,000 | 368,399 | 69,756 | 298,643 | 28.3 | 5.4 | 22.9 | 3.621 |
| 2007 | 13,318,000 | 366,128 | 70,030 | 296,098 | 27.4 | 5.2 | 22.2 | 3.461 |
| 2008 | 13,678,000 | 369,769 | 70,233 | 299,536 | 27.0 | 5.1 | 21.9 | 3.386 |
| 2009 | 14,017,000 | 351,628 | 71,707 | 279,921 | 25.1 | 5.1 | 20.0 | 3.122 |
| 2010 | 14,362,000 | 361,906 | 72,748 | 289,158 | 25.2 | 5.1 | 20.1 | 3.095 |
| 2011 | 14,714,000 | 373,692 | 72,354 | 301,338 | 25.4 | 4.9 | 20.5 | 3.088 |
| 2012 | 15,073,000 | 388,613 | 72,657 | 315,956 | 25.8 | 4.8 | 21.0 | 3.105 |
| 2013 | 15,438,000 | 387,342 | 76,639 | 310,703 | 25.1 | 5.0 | 20.1 | 3.050 |
| 2014 | 15,807,000 | 386,195 | 77,807 | 308,388 | 24.4 | 4.9 | 19.5 | 3.046 |
| 2015 | 16,176,000 | 391,425 | 80,876 | 310,549 | 24.2 | 5.0 | 19.2 | 2.896 |
| 2016 | 16,548,000 | 390,382 | 82,585 | 307,797 | 23.7 | 5.0 | 18.7 | 2.804 |
| 2017 | 16,924,000 | 381,664 | 81,726 | 299,938 | 22.5 | 4.8 | 17.7 | 2.663 |
| 2018 (C) | 17,346,950 | 383,263 | 83,071 | 300,192 | 22.1 | 5.1 | 17.0 | |
| 2019 (C) | 17,915,568 |
(C) = Census results.
Fertility and births (demographic and health surveys)
Total fertility rate (TFR) (wanted fertility rate) and crude birth rate (CBR):[31][32]
| Year | CBR (total) | TFR (total) | CBR (urban) | TFR (urban) | CBR (rural) | TFR (rural) |
|---|---|---|---|---|---|---|
| 1987 | 5.6 (4.9) | 4.1 (3.5) | 6.5 (5.8) | |||
| 1995 | 5.1 (4.0) | 3.8 (3.0) | 6.2 (4.8) | |||
| 1998-99 | 38.0 | 5.0 (4.1) | 34.8 | 4.1 (3.4) | 40.1 | 5.8 (4.6) |
| 2002 | 4.4 | 3.4 | 5.2 | |||
| 2008-09 | 3.6 | 2.9 | 4.2 | |||
| 2014-15 | 27.3 | 3.1 (2.6) | 22.5 | 2.5 (2.0) | 31.0 | 3.7 (3.0) |
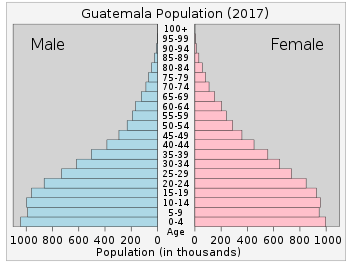
Structure of the population
Structure of the population (01.07.2005) (estimates):[33]
| Age group | Male | Female | Total | % |
|---|---|---|---|---|
| Total | 6 197 399 | 6 502 381 | 12 699 780 | 100 |
| 0-4 | 1 035 549 | 1 000 763 | 2 036 312 | 16,03 |
| 5-9 | 921 924 | 901 718 | 1 823 642 | 14,36 |
| 10-14 | 815 791 | 808 328 | 1 624 119 | 12,79 |
| 15-19 | 685 359 | 694 215 | 1 379 574 | 10,86 |
| 20-24 | 571 385 | 608 879 | 1 180 264 | 9,29 |
| 25-29 | 446 309 | 506 386 | 952 695 | 7,50 |
| 30-34 | 340 378 | 412 767 | 753 145 | 5,93 |
| 35-39 | 270 907 | 329 253 | 600 160 | 4,73 |
| 40-44 | 225 243 | 267 504 | 492 747 | 3,88 |
| 45-49 | 191 635 | 218 053 | 409 688 | 3,23 |
| 50-54 | 175 311 | 191 751 | 367 062 | 2,89 |
| 55-59 | 149 593 | 161 320 | 310 913 | 2,45 |
| 60-64 | 113 686 | 119 957 | 233 643 | 1,84 |
| 65-69 | 94 128 | 98 864 | 192 992 | 1,52 |
| 70-74 | 74 463 | 81 804 | 156 267 | 1,23 |
| 75-79 | 50 340 | 57 089 | 107 429 | 0,85 |
| 80+ | 35 398 | 43 730 | 79 128 | 0,62 |
| Age group | Male | Female | Total | Percent |
|---|---|---|---|---|
| 0-14 | 2 773 264 | 2 710 809 | 5 484 073 | 43,18 |
| 15-64 | 3 169 806 | 3 510 085 | 6 679 891 | 52,60 |
| 65+ | 254 329 | 281 487 | 535 816 | 4,22 |
Structure of the population (01.07.2010) (estimates) (projections based on the 2002 Population Census):
| Age group | Male | Female | Total | % |
|---|---|---|---|---|
| Total | 7 003 337 | 7 358 328 | 14 361 666 | 100 |
| 0-4 | 1 103 521 | 1 062 224 | 2 165 745 | 15,08 |
| 5-9 | 1 017 180 | 987 490 | 2 004 670 | 13,96 |
| 10-14 | 906 603 | 891 659 | 1 798 262 | 12,52 |
| 15-19 | 794 459 | 795 688 | 1 590 147 | 11,07 |
| 20-24 | 646 911 | 675 214 | 1 322 125 | 9,21 |
| 25-29 | 538 214 | 590 746 | 1 128 960 | 7,86 |
| 30-34 | 418 535 | 494 657 | 913 192 | 6,36 |
| 35-39 | 323 010 | 402 681 | 725 691 | 5,05 |
| 40-44 | 258 454 | 321 849 | 580 303 | 4,04 |
| 45-49 | 215 304 | 260 145 | 475 449 | 3,31 |
| 50-54 | 182 662 | 211 040 | 393 702 | 2,74 |
| 55-59 | 165 910 | 184 214 | 350 124 | 2,44 |
| 60-64 | 139 395 | 152 936 | 292 331 | 2,04 |
| 65-69 | 103 433 | 111 058 | 214 491 | 1,49 |
| 70-74 | 81 809 | 88 219 | 170 028 | 1,18 |
| 75-79 | 60 257 | 68 733 | 128 990 | 0,90 |
| 80+ | 47 678 | 59 778 | 107 456 | 0,75 |
| Age group | Male | Female | Total | Percent |
|---|---|---|---|---|
| 0-14 | 3 027 304 | 2 941 373 | 5 968 677 | 41,56 |
| 15-64 | 3 682 856 | 4 089 167 | 7 772 023 | 54,12 |
| 65+ | 293 177 | 327 788 | 620 965 | 4,32 |
Structure of the population (2015):[34]
| Age group | Total | % |
|---|---|---|
| Total | 16 176 133 | 100 |
| 0-4 | 2 262 514 | 13.99 |
| 5-9 | 2 142 308 | 13.24 |
| 10-14 | 1 988 541 | 12.29 |
| 15-19 | 1 776 352 | 10.98 |
| 20-24 | 1 553 450 | 9.60 |
| 25-29 | 1 286 639 | 7.95 |
| 30-34 | 1 099 039 | 6.79 |
| 35-39 | 889 673 | 5.50 |
| 40-44 | 707 191 | 4.37 |
| 45-49 | 563 431 | 3.48 |
| 50-54 | 459 432 | 2.84 |
| 55-59 | 377 242 | 2.33 |
| 60-64 | 330 803 | 2.05 |
| 65+ | 739 518 | 4.57% |
| Age group | Total | Percent |
|---|---|---|
| 0-14 | 6 393 363 | 39.52 |
| 15-64 | 9 043 252 | 55.90 |
| 65+ | 739 518 | 4.57 |
Marriage and childbearing
The legal age for females to get married in Guatemala was 14, but was raised to 16 with parental consent and 18 without in November 2015. This phenomenon, known as child marriage, is prevalent in Central America; in rural areas of Guatemala, 53% of 20 to 24 year-old women married before their 18th birthday. Once married, young girls are likely to abandon their education and are exposed to domestic and sexual violence. They are no longer seen as girls; their husbands, who are often older men, see them as servants. Frequently births are at home. Most of these women are isolated without networks of support.[35]
In most cases, motherhood comes after marriage. However, due to the fact that these young women' bodies are not entirely developed, many pregnancies result in high complications and high risks for both the mother and baby, during and after labor.[36] Because there is limited access to health services, women in Guatemala choose a different alternative when it comes to the care during and after child delivery. Pregnancies before marriage are on the rise and unmarried women make their decision based on their image more than their safety.[37] Single Guatemalan women may choose midwives as their health care provider during pregnancy and delivery to avoid feeling ashamed.[37] Other women know the midwives in the community personally so they opt for a private healthcare provider.[37] Throughout the country, midwives are known as the providers of choice for approximately 80% of the births even though they are not professionally trained.[37] This contributes to the increasing infant mortality rate of 100 per 1,000 births as reported in some Guatemalan communities.[37]
Other demographic statistics
Demographic statistics according to the World Population Review in 2019.[38]
- One birth every 1 minutes
- One death every 6 minutes
- One net migrant every 58 minutes
- Net gain of one person every 2 minutes
Demographic statistics according to the CIA World Factbook, unless otherwise indicated.[39]
- Population
- 16,581,273 (July 2018 est.)
- Ethnic groups
mestizo (mixed Amerindian-Spanish - in local Spanish called Ladino) and European 60.1%, Maya 39.3% (K'iche 11.3%, Q'eqchi 7.6%, Kaqchikel 7.4%, Mam 5.5%, other 7.5%), non-Maya, non-mestizo 0.15% (Xinca (indigenous, non-Maya), Garifuna (mixed West and Central African, Island Carib, and Arawak)), other 0.5% (2001 est.)
- Age structure
- 0-14 years: 34.55% (male 2,919,281 /female 2,810,329)
- 15-24 years: 20.23% (male 1,688,900 /female 1,665,631)
- 25-54 years: 35.47% (male 2,878,075 /female 3,002,920)
- 55-64 years: 5.28% (male 407,592 /female 468,335)
- 65 years and over: 4.46% (male 336,377 /female 403,833) (2018 est.)
- Median age
- total: 22.5 years. Country comparison to the world: 179th
- male: 22 years
- female: 23.1 years (2018 est.)
- Birth rate
- 24.6 births/1,000 population (2018 est.) Country comparison to the world: 50th
- Death rate
- 5 deaths/1,000 population (2018 est.) Country comparison to the world: 194th
- Total fertility rate
- 2.87 children born/woman (2018 est.) Country comparison to the world: 58th
- Net migration rate
- -2.4 migrant(s)/1,000 population (2018 est.) Country comparison to the world: 168th
- Population growth rate
- 1.72% (2018 est.) Country comparison to the world: 59th
- Mother's mean age at first birth
- 21.2 years (2014/15 est.)
- note: median age at first birth among women 25-29
- Contraceptive prevalence rate
- 60.6% (2014/15)
- Dependency ratios
- total dependency ratio: 68.7 (2015 est.)
- youth dependency ratio: 61.1 (2015 est.)
- elderly dependency ratio: 7.6 (2015 est.)
- potential support ratio: 13.1 (2015 est.)
- Life expectancy at birth
- total population: 71.8 years
- male: 69.8 years
- female: 73.9 years (2018 est.)
- Languages
- Spanish (official) 68.9%, Maya languages 30.9% (K'iche 8.7%, Q'eqchi 7%, Mam 4.6%, Kaqchikel 4.3%, other 6.3%), other 0.3% (includes Xinca and Garifuna) (2001 est.)
- note: the 2003 Law of National Languages officially recognized 23 indigenous languages, including 21 Maya languages, Xinka, and Garifuna
- Urbanization
- urban population: 51.1% of total population (2018)
- rate of urbanization: 2.68% annual rate of change (2015-20 est.)
- Education expenditures
- 2.8% of GDP (2017) Country comparison to the world: 149th
- Literacy
definition: age 15 and over can read and write (2015 est.)
- total population: 81.5%
- male: 87.4%
- female: 76.3% (2015 est.)
- School life expectancy (primary to tertiary education)
- total: 11 years
- male: 11 years
- female: 11 years (2014)
- Unemployment, youth ages 15–24
- total: 6.1%. Country comparison to the world: 151st
- male: 4.6%
- female: 9.1% (2016 est.)
Languages
The official language of Guatemala is Spanish. It is spoken by nearly 93% of the population and is found mainly in the departments of the Southern region, Eastern region, Guatemala City and Peten.[40] Though the official language is Spanish, it is often the second language among the Indigenous population.
Approximately 23 additional Amerindian languages are spoken by more than 40% of the population.[41] 21 Mayan languages, one indigenous, and one Arawakan are spoken in Guatemala.[42] The most significant are; Quiche, Cakchiquel, Kekchi, Mam, Garifuna and Xinca.[41]
There are also significant numbers of German, Chinese, French and English speakers.
| Rank | Language | Language family |
| 1 | Spanish | Indo-European |
| 2 | K’iche’ | Mayan |
| 3 | Q'eqchi' | Mayan |
| 4 | Kaqchikel | Mayan |
| 5 | Mam | Mayan |
| 6 | Poqomchi | Mayan |
| 7 | Tz’utujil | Mayan |
| 8 | Achí | Mayan |
| 9 | Q’anjob’al | Mayan |
| 10 | Ixil | Mayan |
| 11 | Akatek | Mayan |
| 12 | Jakaltek | Mayan |
| 13 | Chuj | Mayan |
| 14 | Poqomam | Mayan |
| 15 | Ch'orti' | Mayan |
| 16 | Awakatek | Mayan |
| 17 | Sakapultek | Mayan |
| 18 | Sipakapa | Mayan |
| 19 | Garífuna | Arawakan |
| 20 | Uspantek | Mayan |
| 21 | Tektitek | Mayan |
| 22 | Mopan | Mayan |
| 23 | Xincan languages | Isolate |
| 24 | Itza | Mayan |
Religion
Catholicism was the official religion during the colonial era. Protestantism has increased in recent decades. More than one third of Guatemalans are Protestant, chiefly Evangelicals and Pentecostals. Eastern and Oriental Orthodoxy claim rapid growth, especially among the Indigenous Maya.
The Islamic community in Guatemala is growing, Muslim population of Guatemala is approximately 1,200. Of this population, 95% are Palestinian Arab immigrants. There is a mosque in the outskirts of Guatemala City called the Islamic Da'wah Mosque of Guatemala (Spanish: Mezquita de Aldawaa Islámica) which is available for the five daily prayers and offers classes in Islamic studies.
The president of the Islamic Community of the country is Jamal Mubarak.
Traditionally a large proportion of Guatemalans have been Catholics. This has declined, from 90% of the population in 1950, 61% in 1986, 65% in 1991 (after the visit of the Pope John Paul II), 57% in 2006,[44] and 47% in 2013.[43] Between 1882 and 1940, 2% of the population were Protestants, 17.98% were Protestant in 1978, 30% in 1986, 21% in 1991, 25.27% in 2001, 30.70% in 2006[44] and 40% Protestant in 2014.[43]
3% of Guatemalans follow other religions.[43] 9% are non-religious.[43] Guatemalans who self-identify as atheists/agnostics were 3.25% of the population in 1982, 12% in 1991, and 9,9%% in 2006.[44] According to the Latinobarómetro, 8% of the population were irreligious in 1996, 15% in 2000, 16% in 2007, 11% in 2008, 13% in 2010, with 10% irreligious in 2014.[43] The "other religions" were 9% in 1996 to 14% one year later, and 3% in 2013.[43]
| Religious evolution in Guatemala (by national census) | |||||
|---|---|---|---|---|---|
| Year | % Catholic | % Evangelic | % others | % no religion | |
| 1882-1940 | 97% | 2% | 0.1% | 0.4% | |
| 1978 | 80.1% |
17.9% |
0.8% |
1.2% | |
| 1980 | 77% |
19.1% |
1.1% |
2.8% | |
| 1982 | 73.4% |
22.3% |
1.1% |
3.2% | |
| 1986 | 62.9% |
30% |
2% |
6% | |
| 1991 | 64.6% |
21% |
2.4% |
12% | |
| 1992 | 60.4% |
26.4% |
2.1% |
11.1% | |
| 2001 | 58.1% |
25.2% |
2.5% |
14.2% | |
| 2006 | 57.3% |
30.7% |
2.1% |
9.9% | |
| 2010 | 47.6% |
31.7% |
2.4% |
18.3% | |
| 2012 | 47.9% |
38.2% |
2.3% |
11.6% | |
| Religious identity in Guatemala (1996-2013) | ||||
|---|---|---|---|---|
| Year | % Catholics | % Protestants | % atheists/non-religious | % others |
| 1996 | 54% | 25% | 8% | 13% |
| 1997 | 54% | 24% | 6% | 16% |
| 1998 | 69% | 19% | 8% | 3% |
| 1999 | 60% | 27% | 9% | 3% |
| 2000 | 52% | 29% | 15% | 4% |
| 2001 | 58% | 29% | 7% | 6% |
| 2002 | 57% | 29% | 8% | 6% |
| 2003 | 59% | 32% | 7% | 2% |
| 2004 | 53% | 33% | 12% | 2% |
| 2005 | 57% | 31% | 10% | 2% |
| 2006 | 54% | 34% | 10% | 2% |
| 2007 | 48% | 36% | 15% | 1% |
| 2008 | 51% | 36% | 11% | 2% |
| 2009 | 54% | 34% | 9% | 3% |
| 2010 | 47% | 39% | 12% | 2% |
| 2011 | 55% | 30% | 11% | 4% |
| 2013 | 47% | 40% | 10% | 3% |
References
- Guatemala: Estimaciones de la Población total por municipio. Período 2008-2020 Archived 2015-04-04 at the Wayback Machine
- "Caracterización estadística República de Guatemala 2012" (PDF). INE. Archived from the original on November 2012. Retrieved 2014-11-02.
- "Así ha crecido la población de Guatemala". República. Retrieved 18 September 2019.
- "Censo de Población". Instituto Nacional de Estadística. Retrieved 18 September 2019.
- "CIA - The World Factbook". Cia.gov. Retrieved 2013-04-22.
- https://www.censopoblacion.gt/mapas
- "Population Division of the Department of Economic and Social Affairs of the United Nations Secretariat, World Population Prospects: The 2012 Revision".
- ""World Population prospects – Population division"". population.un.org. United Nations Department of Economic and Social Affairs, Population Division. Retrieved November 9, 2019.
- ""Overall total population" – World Population Prospects: The 2019 Revision" (xslx). population.un.org (custom data acquired via website). United Nations Department of Economic and Social Affairs, Population Division. Retrieved November 9, 2019.
- "CIA World Factbook, Guatemala". July 2011. Retrieved 22 December 2011.
- Lahmeyer, Jan (2002). "Guatemala: historical demographical data of the whole country". Population Statistics. Retrieved 2015-05-03.
- "World Population Prospects - Population Division - United Nations". esa.un.org. Retrieved 2017-03-28.
- "Republica de Guatemala". 2009-04-16. Archived from the original on 2009-04-16. Retrieved 2018-03-25.
- "Guatemalan population growth (by departament)" (web page). INE. Retrieved 2014-12-12.
- Economic Migrants Replace Political Refugees see Table 1. Emigration Flows from Guatemala, 1960s through 2005. Retrieved on, 18 November 2014
- "Largest U.S. Immigrant Groups over Time, 1960-Present". Migration Policy Institute. Retrieved 4 May 2015.
- The 2000 U.S. Census recorded 480,665 Guatemalan-born respondents; see Smith (2006)
- Smith, James (April 2006). "DRC Migration, Globalisation and Poverty". Archived from the original on 2016-12-27. Retrieved 2015-04-22. Used the Version 4 data.
- Da, Wei Wei (2002). "Guatemalans in Canada: Contexts of Departure and Arrival" (PDF). Latin American Study Group. Retrieved June 1, 2010.
- National population of the National Institute of Statistics (INE). demographic info 2010.
- "Ancient Jewish Tradition of clothing". Archived from the original on 2015-04-02.
- "Ultra-orthodox Lev Tahor settlement has spurred tension in Guatemalan village, CIJA says".
- "More Lev Tahor sect members leaving Canada for Guatemala".
- "Guatemala Population 2020". worldpopulationreview.com. Retrieved 2020-03-05.
- "The World Factbook". Central Intelligence Agency. March 25, 2018.
- "Guatemala - Central America: guatemala history, guatemala population, culture dominant, guatemala republic, independence spain". www.countriesquest.com.
- "GUATEMALA: DEL MESTIZAJE A LA LADINIZACION, 1524-1964" (PDF). CIRMA. Retrieved 2014-11-04.
- "Belize" (PDF). 2010 Belize Housing and Population Census. Statistical Institute of Belize. Archived from the original (PDF) on 12 August 2011. Retrieved 7 June 2012.
- "Demographic Yearbook System". United Nations Statistics Division - UNSD. Retrieved 28 January 2020.
- "Estadísticas vitales". Instituto Nacional de Estadística - INE. Retrieved 28 January 2020.
- "The DHS Program - Page Not Found" (PDF). www.dhsprogram.com.
- "The DHS Program - Survey Search". www.dhsprogram.com.
- "United Nations Statistics Division - Demographic and Social Statistics". unstats.un.org.
- "Tema / Indicadores". www.ine.gob.gt.
- Sinclair, Stephanie. "Child, Bride, Mother." New York Times, Feb 8, 2015. https://www.nytimes.com/interactive/2015/02/08/opinion/sunday/exposures-child-bride-mother-stephanie-sinclair.html
- Sinclair, Stephanie. "Child, Bride, Mother." New York Times, Feb 08, 2015, Late Edition (East Coast). https://search.proquest.com/docview/1652674639
- Wong, Po Yin. "Mothers' Marital Status and Type of Delivery Medical Care in Guatemala." Population Research and Policy Review 30, no. 1 (2011): 43-57. JSTOR 41487854.
- "Guatemala Population 2019", World Population Review
- "World Factbook CENTRAL AMERICA : GUATEMALA", The World Factbook, July 12, 2018
- "CIA - The World Factbook". Cia.gov. Retrieved 2013-04-22.
- "Central America and Caribbean :: GUATEMALA". CIA The World Factbook.
- "What Languages Are Spoken In Guatemala?". WorldAtlas. Retrieved 2018-04-09.
- "Las religiones en tiempos del Papa Francisco" (in Spanish). Latinobarómetro. April 2014. p. 6. Archived from the original (pdf) on 10 May 2015. Retrieved 4 April 2015.
- El crecimiento de las Iglesias Evangélicas en Guatemala: Una mirada Socio-religiosa Archived 2014-01-15 at the Wayback Machine Guatemala, November 2010
| Guatemalan Indians (Maya and others) | ||
|---|---|---|
| Former and extinct | ||
| Guatemalan mestizo |
| |
| Descendants of Europeans (whites or Criollo) | ||
| Descendants of Asians | ||
| Afro-Descendants | ||
| Americas |
| |
| History |  | ||||
|---|---|---|---|---|---|
| Geography |
| ||||
| Politics | |||||
| Economy | |||||
| Society |
| ||||
| |||||