Bicycle performance
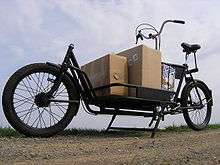
A bicycle's performance is extraordinarily efficient. In terms of the amount of energy a person must expend to travel a given distance, cycling is calculated to be the most efficient self-powered means of transportation.[1] In terms of the ratio of cargo weight a bicycle can carry to total weight, it is also a most efficient means of cargo transportation.


Mechanical efficiency
From a mechanical viewpoint, up to 99% of the energy delivered by the rider into the pedals is transmitted to the wheels (clean, lubricated new chain at 400 W), although the use of gearing mechanisms reduces this by 1–7% (clean, well-lubricated derailleurs), 4–12% (chain with 3-speed hubs), or 10–20% (shaft drive with 3-speed hubs). The higher efficiencies in each range are achieved at higher power levels and in direct drive (hub gears) or with large driven cogs (derailleurs).[2][3]
Energy efficiency
A human traveling on a bicycle at 16–24 km/h (10–15 mph), using only the power required to walk, is the most energy-efficient means of human transport generally available.[4] Air drag, which increases with the square of speed, requires increasingly higher power outputs relative to speed, power increasing with the cube of speed as power equals force times velocity. A bicycle in which the rider lies in a supine position is referred to as a recumbent bicycle or, if covered in an aerodynamic fairing to achieve very low air drag, as a streamliner.
On firm, flat ground, a 70 kg (150 lb) person requires about 60 watts[5] to walk at 5 km/h (3.1 mph). That same person on a bicycle, on the same ground, with the same power output, can travel at 15 km/h (9.3 mph) using an ordinary bicycle,[6] so in these conditions the energy expenditure of cycling is one-third that of walking.
Energy output
Active humans can produce between 1.5 W/kg (untrained), 3.0 W/kg (threshold for the medical definition of “fit”), and 6.6 W/kg (top-class male athletes). 5 W/kg is about the level reachable by the highest tier of male amateurs for longer periods.[7] Maximum sustained power levels during one hour range from about 200 W (NASA experimental group of "healthy men") to 500 W (men's world hour record).[8]
Energy input
The energy input to the human body is in the form of food energy, usually quantified in kilocalories [kcal] or kiloJoules [kJ=kWs]. This can be related to a certain distance travelled and to body weight, giving units such as kJ/(km∙kg). The rate of food consumption, i.e. the amount consumed during a certain period of time, is the input power. This can be measured in kcal/day or in J/s = W (1000 kcal/d ~ 48.5 W).
This input power can be determined by measuring oxygen uptake, or in the long term food consumption, assuming no change of weight. This includes the power needed just for living, called the basal metabolic rate BMR or roughly the resting metabolic rate.
The required food can also be calculated by dividing the output power by the muscle efficiency. This is 18–26%. From the example above, if a 70 kg person is cycling at 15 km/h by expending 60 W and a muscular efficiency of 20% is assumed, roughly 1 kJ/(km∙kg) extra food is required. For calculating the total food required during the trip, the BMR must first be added to the input power. If the 70 kg person is an old, short woman, her BMR could be 60 W, in all other cases a bit higher.[9] Viewed this way the efficiency in this example is effectively halved and roughly 2 kJ/(km∙kg) total food is required.
Although this shows a large relative increase in food required for low power cycling, in practice it is hardly noticed, as the extra energy cost of an hour's cycling can be covered with 50 g nuts or chocolate. With long and fast or uphill cycling, the extra food requirement however becomes evident.
To complete the efficiency calculation, the type of food consumed determines the overall efficiency. For this the energy needed to produce, distribute and cook the food must be considered.
Typical speeds
In utility cycling there is a large variation; an elderly person on an upright roadster might do less than 10 km/h (6.2 mph) while a fitter or younger person could easily do twice that on the same bicycle. For cyclists in Copenhagen, the average cycling speed is 15.5 km/h (9.6 mph).[10]
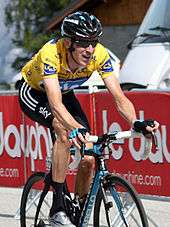
On a racing bicycle, a reasonably fit rider can ride at 40 km/h (25 mph) on flat surface.
In competitive cycling a sustainable high speed is augmented by the aerodynamic effects of the peloton. The group can maintain a much higher speed over extended distance due to various cyclists taking turns at the head of the wind then dropping behind to rest. A team time trial produces the same effect.
Cycling speed records
The highest speed officially recorded for any human-powered vehicle (HPV) on level ground and with calm winds and without external aids (such as motor pacing and wind-blocks, but including a defined amount of gravity assist) is 144.18 km/h (89.59 mph) set in 2016 by Todd Reichert in the Eta Speedbike, a streamlined recumbent bicycle.[11] In the 1989 Race Across America, a group of HPVs crossed the United States in just 5 days.[12][13][14][15] The highest speed officially recorded for a bicycle ridden in a conventional upright position under fully faired conditions was 82.52 km/h (51.28 mph) over 200 m.[16] That record was set in 1986 by Jim Glover on a Moulton AM7 at the Human Powered Speed Championships during Expo86 World Fair in Vancouver. The fastest bicycle speed in slipstream is 296km/h (183.9 mph), set by Denise Mueller-Korenek in 2018 on the Bonneville Salt Flats. This involved slipstreaming behind a dragster.
Reduction of weight and rotating mass
There has been major corporate competition to lower the weight of racing bikes in order to be faster uphill and accelerating. The UCI sets a limit of 6.8 kg on the minimum weight of bicycles to be used in sanctioned races.[17]
Advantages of reduced mass
For cycling on the level at a constant speed, a large weight reduction saves only a negligible amount of power and it is on the contrary beneficial to add mass in the form of aerodynamic improvements. But for climbing steeply, any weight reduction can be felt directly. E.g., a reduction of 10% of the total system weight (bicycle, rider, and luggage combined) will save nearly 10% power.
A reduced mass is also directly felt when accelerating. For example, the Analytic Cycling calculator gives a time/distance advantage of 0.16 s/188 cm for a sprinter with 500 g lighter wheels. In a criterium race, if a rider has to brake entering each corner, then this is wasted as heat. For a flat criterium at 40 km/h, 1 km circuit, 4 corners per lap, 10 km/h speed loss at each corner, one hour duration, there would be 160 corner "jumps". For 90 kg rider and bike, this adds roughly one third effort compared to the same ride at a steady speed, and a mass reduction of 10% of the total system weight (bicycle, rider, and luggage combined) could thus give about a 3% advantage.
Advantages of light wheels
The mass of tires and rims must be accelerated linearly and rotationally. It can be shown that the effect of rim and tire mass of typical spoked wheels is effectively doubled. Reducing their mass is thus especially noticeable in the case of sprints and corner "jumps" in a criterium.[18]
Power required
Heated debates over the relative importance of weight saving and optimization of tires and aerodynamics are common in cycling. By calculating the power requirements for moving a bike and rider, one can evaluate the relative energy costs of air resistance, rolling resistance, slope resistance and acceleration.
There are well-known equations that give the power required to overcome the various resistances mainly as a function of speed:

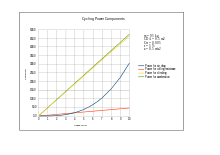
Air drag power is initially very low and increases with the cube of the speed.
Rolling resistance power is higher at first but rises only gently.
Climbing a 5% grade is seen to be almost the same as continual acceleration with 0.5 m/s2.
Air drag
The power needed to overcome air drag or resistance is:
- in still air, or
- in a headwind,
where
- is the air density, which is about 1.225 kg/m^3 at sea level and 15 deg. C.[19]
- is the speed relative to the road,
- is the apparent headwind, and
- is a characteristic area times its associated drag coefficient.
The concept of apparent wind is only directly applicable here if it comes from a true headwind or tailwind. Then is the scalar sum of and the headwind or the difference between and the tailwind. If this difference is negative, must be regarded as assistance rather than resistance. If however the wind has a sideways component, the apparent wind must be calculated with a vector sum and, especially if the bicycle is streamlined, the calculation of lateral and drag forces becomes more complex; a proper treatment involves considering the forces on the surfaces like the forces on sails.
The drag coefficient depends on the shape of the object and on the Reynolds number, which itself depends on . However, if is the cross sectional area, can be roughly approximated as 1 for usual cycling speeds of a rider on an upright bicycle.
Rolling resistance
The power for overcoming the tires' rolling resistances is given by:
where g is gravity, nominally 9.8 m/s^2, and m is mass (kg). The approximation can be used with all normal coefficients of rolling resistance . Usually this is assumed to be independent of (speed of the bicycle on the road) although it is recognized that it increases with speed. Measurements on a roller-mechanism give low-speed coefficients of 0.003 to 0.006 for a variety of tires inflated to their maximum recommended pressures, increasing about 50% at 10 m/s.[20]
Climbing power
The vertical climbing power on slope is given by
- .[21]
This approximation approaches the real solution for small, i.e. normal grades. For extremely steep slopes such as 0.35 the approximation gives an overestimation of about 6%.
As this power is used to increase the potential energy of bike and rider, it is returned as motive power when going downhill and not lost unless the rider brakes or travels faster than desired.
Power for acceleration
The power for accelerating the bike and rider having total mass m with acceleration a and rotationally also the wheels having mass is:
The approximation is valid if is assumed to be concentrated at the rims and tires and these are not slipping. The mass of such wheels can thus be counted twice for this calculation, independent of the wheels' sizes.
As this power is used to increase the kinetic energy of bike and rider, it is returned when decelerating and not lost unless the rider brakes or travels faster than desired.
Total power
where is the mechanical efficiency of the drive train described at the beginning of this article.
Given this simplified equation, one can calculate some values of interest. For example, assuming no wind, one gets the following results for power delivered to the pedals (watts):
- 175 W for a 90 kg bike + rider to go 9 m/s (32 km/h or 20 mph) on the flat (76% of effort to overcome aerodynamic drag), or 2.6 m/s (9.4 km/h or 5.8 mph) on a 7% grade (2.1% of effort to overcome aerodynamic drag).
- 300 W for a 90 kg bike + rider at 11 m/s (40 km/h or 25 mph) on the flat (83% of effort to overcome aerodynamic drag) or 4.3 m/s (15 km/h or 9.5 mph) on a 7% grade (4.2% of effort to overcome aerodynamic drag).
- 165 W for a 65 kg bike + rider to go 9 m/s (32 km/h or 20 mph) on the flat (82% of effort to overcome aerodynamic drag), or 3.3 m/s (12 km/h or 7.4 mph) on a 7% grade (3.7% of effort to overcome aerodynamic drag).
- 285 W for a 65 kg bike + rider at 11 m/s (40 km/h or 25 mph) on the flat (87% of effort to overcome aerodynamic drag) or 5.3 m/s (19 km/h or 12 mph) on a 7% grade (6.1% of effort to overcome aerodynamic drag).
Reducing the weight of the bike + rider by 1 kg would increase speed by 0.01 m/s at 9 m/s on the flat (5 seconds in a 32 km/h (20 mph), 40-kilometre (25 mile) TT). The same reduction on a 7% grade would be worth 0.04 m/s (90 kg bike + rider) to 0.07 m/s (65 kg bike + rider). If one climbed for 1 hour, saving 1 lb would gain between 69 metres (225 ft) and 110 m (350 ft) – less effect for the heavier bike + rider combination (e.g., 0.06 km/h (0.04 mph) * 1 h * 1,600 m (5,200 ft)/mi = 69 m (226 ft)). For reference, the big climbs in the Tour de France and the Giro d'Italia have the following average grades:
Giro d'Italia[22]
- Stelvio Pass = 7.45% over 24.3 km;
- Colle delle Finestre = 9.1% over 18.6 km;
- Colle dell'Agnello = 6.5% over 22 km;
- Passolanciano-Maielletta, also known as Blockhaus = 9.4% over 22 km;
- Plan de Corones = 10% over 5.2 km;
- Mortirolo = 10.4% over 12.5 km;
- Monte Zoncolan = 12% over 10.1 km;
Tour de France
- Tourmalet = 7%
- Galibier = 7.5%
- Alpe D'Huez = 8.6%[23]
- Mont Ventoux = 7.1%.
See also
References
- S.S. Wilson (March 1973). "Bicycle Technology". Scientific American.
- Wilson, David Gordon; Jim Papadopoulos (2004). Bicycling Science (Third ed.). Massachusetts Institute of Technology. p. 343. ISBN 0-262-23111-5.
- Phil Sneiderman Homewood (August 30, 1999). "Pedal Power Probe Shows Bicycles Waste Little Energy". Johns Hopkins Gazette. Archived from the original on 1 February 2010. Retrieved 2010-02-21.
- MacKay, David J C (2008). Sustainable Energy (First ed.). UIT Cambridge limited. p. 128.
- Kohsuke Shimomura; et al. (2009-11-10). "A study of passive weight-bearing lower limb exercise effects on local muscles and whole body oxidative metabolism: a comparison with simulated horse riding, bicycle, and walking exercise" (PDF). Retrieved 2014-07-26.
- Zorn, Walter (2015-03-27). "Speed&Power Calculator". Retrieved 2015-03-27.
- Power profiling data table version 4.0 by Andy R. Coggan
- Wilson, David Gordon; Jim Papadopoulos (2004). Bicycling Science (Third ed.). The MIT Press. p. 44. ISBN 0-262-73154-1.
- "Harris-Benedict-equation calculator". 2015-03-27. Archived from the original on 2015-04-02. Retrieved 2015-03-27.
- "Bicycle statistics". City of Copenhagen website. City of Copenhagen. 13 June 2013. Archived from the original on 12 December 2013. Retrieved 12 December 2013.
- "New Human-Powered Speed Record Set at 89.6 Mph in Egg-Shaped Bike". Popular Mechanics. 20 September 2016. Retrieved 20 September 2016.
- Wired.com (2008-09-25). "World's Fastest Cyclist Hits 82.3 MPH". Archived from the original on 26 September 2008. Retrieved 2008-09-26.
- "International Human Powered Vehicle Association Official Speed Records". Archived from the original on 12 April 2008. Retrieved 2008-03-04.
- "Fastest Human Powered Lists". Archived from the original on 8 March 2008. Retrieved 2008-03-04.
- "HPV And Bicycle Speed Records Men – Single Rider". Archived from the original on 12 April 2008. Retrieved 2008-03-04.
- "Moulton Bicycle Company: Records and Racing". Archived from the original on 12 April 2010. Retrieved 2010-02-26.
- "UCI Rules" (PDF). 2015-03-26. Retrieved 2015-03-30.
- "Technical Q&A with Lennard Zinn: The great rotating-weight debate". Archived from the original on 2006-10-17. Retrieved 2007-02-03.
- Note that for the air density can be found using the barometric formula. It is 1.293 kg/m3 at 0 °C and 1 atmosphere.
- Charles Henry (2015-03-15). "Diagram of Crr as a function of V". Retrieved 2015-03-30.
- The sine is often neglected; for a correct treatment see: "Validation of a Mathematical Model for Road Cycling Power" by James C. Martin et al., Journal of Applied Biomechanics, Volume 14, Issue 3, August 14, 1998, pp.276 – 291
- The hardest climbs of the Giro d'Italia.
- "Sastre wins the 2008 L'Alpe d'Huez stage". July 23, 2008: Velo News. Archived from the original on 19 February 2009. Retrieved 2009-01-14. Cite journal requires
|journal=(help)