1986 Derby City Council election
The 1986 Derby City Council election took place on 8 May 1986 to elect members of Derby City Council in England. Local elections were held in the United Kingdom in 1986.[3] This was on the same day as other local elections. 15 of the council's 44 seats were up for election. The Labour Party retained control of the council.
| |||||||||||||||||||||||||||||||||
15 of the 44 seats in the Derby City Council 23 seats needed for a majority | |||||||||||||||||||||||||||||||||
|---|---|---|---|---|---|---|---|---|---|---|---|---|---|---|---|---|---|---|---|---|---|---|---|---|---|---|---|---|---|---|---|---|---|
| |||||||||||||||||||||||||||||||||
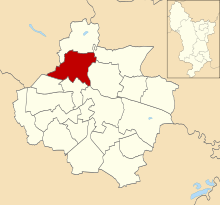
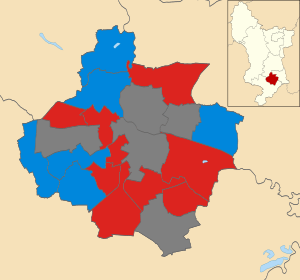 Map showing the results of the 1986 Derby City Council elections. | |||||||||||||||||||||||||||||||||
| |||||||||||||||||||||||||||||||||
Overall results
| Party | Seats | Gains | Losses | Net gain/loss | Seats % | Votes % | Votes | +/− | |
|---|---|---|---|---|---|---|---|---|---|
| Labour | 9 | 0 | 0 | 60.0 | 42.7 | 21,215 | |||
| Conservative | 6 | 0 | 0 | 40.0 | 36.2 | 18,012 | |||
| Alliance | 0 | 0 | 0 | 0.0 | 21.1 | 10,514 | |||
| Total | 15 | 49,741 | |||||||
Ward results
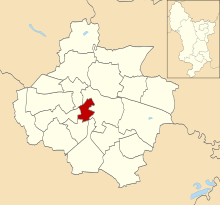
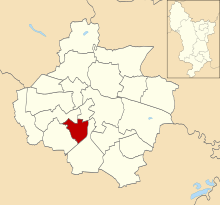
Abbey
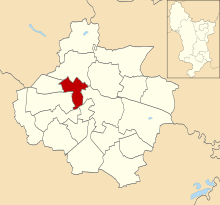
Location of Abbey ward
| Party | Candidate | Votes | % | |
|---|---|---|---|---|
| Labour | M. Walker | 1,842 | 60.9% | |
| Conservative | C. Base | 746 | 24.7% | |
| Alliance | L. Wilson | 436 | 14.4% | |
| Turnout | 30.6% | |||
| Labour hold | ||||
Allestree
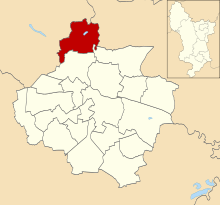
Location of Allestree ward
| Party | Candidate | Votes | % | |
|---|---|---|---|---|
| Conservative | J. Thorpe | 2,563 | 62.3% | |
| Alliance | H. Jones | 957 | 23.3% | |
| Labour | R. Turner | 596 | 14.5% | |
| Turnout | 49.9% | |||
| Conservative hold | ||||
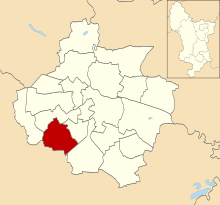
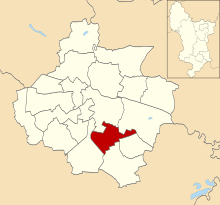
Alvaston
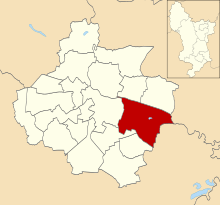
Location of Alvaston ward
| Party | Candidate | Votes | % | |
|---|---|---|---|---|
| Labour | W. Matthews | 1,284 | 42.7% | |
| Alliance | D. Adams | 943 | 31.4% | |
| Conservative | M. Bertalan | 780 | 25.9% | |
| Turnout | 37.5% | |||
| Labour hold | ||||
Babington
Location of Babington ward
| Party | Candidate | Votes | % | |
|---|---|---|---|---|
| Labour | B. Schofield | 1,663 | 57.0% | |
| Alliance | M. Burgess | 763 | 26.2% | |
| Conservative | P. Fullarton | 489 | 16.8% | |
| Turnout | 35.2% | |||
| Labour hold | ||||
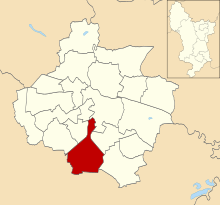
Blagreaves
Location of Blagreaves ward
| Party | Candidate | Votes | % | |
|---|---|---|---|---|
| Conservative | J. Keith | 1,599 | 42.0% | |
| Labour | M. Ainsley | 1,518 | 39.9% | |
| Alliance | D. George | 692 | 18.2% | |
| Turnout | 47.3% | |||
| Conservative hold | ||||
Boulton
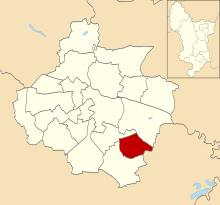
Location of Boulton ward
| Party | Candidate | Votes | % | |
|---|---|---|---|---|
| Labour | A. Kennedy | 1,680 | 43.3% | |
| Conservative | B. Thompson | 1,140 | 29.4% | |
| Alliance | P. Harlow | 1,056 | 27.2% | |
| Turnout | 40.6% | |||
| Labour hold | ||||
Breadsall
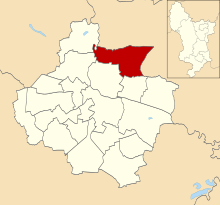
Location of Breadsall ward
| Party | Candidate | Votes | % | |
|---|---|---|---|---|
| Labour | E. Ward | 1,988 | 54.8% | |
| Conservative | G. Andrews | 1,051 | 28.9% | |
| Alliance | H. Holbrook | 592 | 16.3% | |
| Turnout | 33.5% | |||
| Labour hold | ||||
Darley
Location of Darley ward
| Party | Candidate | Votes | % | |
|---|---|---|---|---|
| Conservative | J. Tillett | 2,142 | 46.9% | |
| Labour | M. Repton | 1,487 | 32.6% | |
| Alliance | S. King | 935 | 20.5% | |
| Turnout | 48.4% | |||
| Conservative hold | ||||
Littleover
Location of Littleover ward
| Party | Candidate | Votes | % | |
|---|---|---|---|---|
| Conservative | L. Shepley | 1,498 | 45.6% | |
| Alliance | A. Cooper | 903 | 27.5% | |
| Labour | J. Broughton | 887 | 27.0% | |
| Turnout | 45.9% | |||
| Conservative hold | ||||
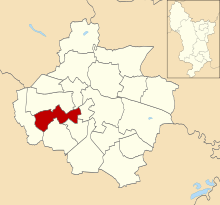
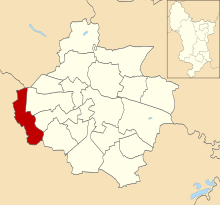
Mackworth
Location of Mackworth ward
| Party | Candidate | Votes | % | |
|---|---|---|---|---|
| Labour | R. Baxter | 1,675 | 60.0% | |
| Conservative | A. Mayell | 743 | 26.6% | |
| Alliance | R. Jackson | 374 | 13.4% | |
| Turnout | 38.1% | |||
| Labour hold | ||||
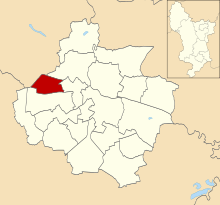
Mickleover
Location of Mickleover ward
| Party | Candidate | Votes | % | |
|---|---|---|---|---|
| Conservative | N. Keene | 1,783 | 49.1% | |
| Alliance | A. Wilbraham | 999 | 27.5% | |
| Labour | M. McReynolds | 849 | 23.4% | |
| Turnout | 43.3% | |||
| Conservative hold | ||||
Normanton
Location of Normanton ward
| Party | Candidate | Votes | % | |
|---|---|---|---|---|
| Labour | L. Shillingford | 1,584 | 58.6% | |
| Conservative | K. Lester | 743 | 27.5% | |
| Alliance | W. Drew | 375 | 13.9% | |
| Turnout | 35.1% | |||
| Labour hold | ||||
Osmanton
Location of Osmaston ward
| Party | Candidate | Votes | % | |
|---|---|---|---|---|
| Labour | R. Laxton | 1,226 | 71.2% | |
| Conservative | D. Brown | 289 | 16.8% | |
| Alliance | P. Elsbury | 208 | 12.1% | |
| Turnout | 22.7% | |||
| Labour hold | ||||
Sinfin
Location of Sinfin ward
| Party | Candidate | Votes | % | |
|---|---|---|---|---|
| Labour | N. Dhindsa | 1,517 | 60.4% | |
| Conservative | B. Larimore | 595 | 23.7% | |
| Alliance | P. James | 401 | 16.0% | |
| Turnout | 33.5% | |||
| Labour hold | ||||
Spondon
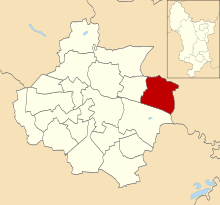
Location of Spondon ward
| Party | Candidate | Votes | % | |
|---|---|---|---|---|
| Conservative | G. Du Sautoy | 1,851 | 44.6% | |
| Labour | M. Tanvir | 1,419 | 34.2% | |
| Alliance | R. Guilford | 880 | 21.2% | |
| Turnout | 40.7% | |||
| Conservative hold | ||||
gollark: Learn heavconlang4857™.
gollark: We all knew you were me.
gollark: No, I mean spinning the platters to 5400RPM or whatever or down to 0, on power changes.
gollark: Spinup/spindown is quite thingy for a disk so leave it plugged in probably.
gollark: Conveniently, 9 bits is also the amount of memory you need to represent your type.
References
- "Council compositions by year". The Elections Centre.
- "Local Election Summaries 1986". The Elections Centre.
- Rallings, Colin; Thrasher, Michael. Local Elections Handbook 1986. The Elections Centre. Retrieved 15 February 2020.
- "Derby City Council Election Results 1979-1995" (PDF). Elections Centre.
| London boroughs |
|
|---|---|
| Metropolitan boroughs |
|
| District councils (England) |
|
| Regional councils (Scotland) |
|
| LEAs | |
This article is issued from Wikipedia. The text is licensed under Creative Commons - Attribution - Sharealike. Additional terms may apply for the media files.