2012 South Lanarkshire Council election
Elections to South Lanarkshire Council were held on 3 May 2012 on the same day as the 31 other local authorities in Scotland. The election used the twenty wards created under the Local Governance (Scotland) Act 2004, with 67 Councillors being elected. Each ward elected either 3 or 4 members, using the STV electoral system.
| |||||||||||||||||||||||||||||||||||||||||||||||||||||||||||||
All 67 seats to South Lanarkshire Council 34 seats needed for a majority | |||||||||||||||||||||||||||||||||||||||||||||||||||||||||||||
|---|---|---|---|---|---|---|---|---|---|---|---|---|---|---|---|---|---|---|---|---|---|---|---|---|---|---|---|---|---|---|---|---|---|---|---|---|---|---|---|---|---|---|---|---|---|---|---|---|---|---|---|---|---|---|---|---|---|---|---|---|---|
| |||||||||||||||||||||||||||||||||||||||||||||||||||||||||||||
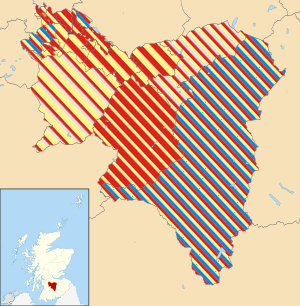 Results by ward. | |||||||||||||||||||||||||||||||||||||||||||||||||||||||||||||
| |||||||||||||||||||||||||||||||||||||||||||||||||||||||||||||
The election saw Labour retain their traditional position as the largest party on the Council as they gained 3 seat from 2007 to be just 1 seat short of an overall majority. The Scottish National Party also increased their representation and remained in second place on the authority with 4 net gains. The Scottish Conservative and Unionist Party were the biggest losers, falling from 8 seats to just 3. Independents lost a seat to return to the Council with 2 seats. The Scottish Liberal Democrats lost 1 seat to be reduced to a solitary member. Following the election the Labour Party again formed an administration.
In February 2013, Labour gained overall control of South Lanarkshire Council after winning aRutherglen South by-election from the SNP.[1]
Election result
| Party | Seats | Gains | Losses | Net gain/loss | Seats % | Votes % | Votes | +/− | |
|---|---|---|---|---|---|---|---|---|---|
| Labour | 33 | 4 | 1 | +3 | 49.3 | 43.18 | 39,895 | +3.58 | |
| SNP | 28 | 4 | 0 | +4 | 41.7 | 36.37 | 33,598 | +7.17 | |
| Conservative | 3 | 0 | 5 | -5 | 4.5 | 10.84 | 10,015 | -2.06 | |
| Independent | 2 | 1 | 2 | -1 | 3.0 | 2.96 | 2,734 | -2.24 | |
| Liberal Democrats | 1 | 0 | 1 | -1 | 1.5 | 2.75 | 2,544 | -4.45 | |
| Scottish Green | 0 | - | - | - | - | 1.44 | 1,326 | -1.26 | |
| East Kilbride Alliance | 0 | - | - | - | - | 0.74 | 681 | -0.46 | |
| UKIP | 0 | - | - | - | - | 0.56 | 515 | +0.56 | |
| Scottish Unionist | 0 | - | - | - | - | 0.30 | 278 | -0.40 | |
| Scottish Christian | 0 | - | - | - | - | 0.25 | 230 | +0.15 | |
| Christian Peoples Alliance | 0 | - | - | - | - | 0.23 | 209 | +0.23 | |
| Scottish Senior Citizens | 0 | - | - | - | - | 0.22 | 199 | +0.22 | |
| Solidarity | 0 | - | - | - | - | 0.18 | 166 | -0.02 | |
Note: "Votes" are the sum of first preference votes across all council wards. The net gain/loss and percentage changes relate to the result of the previous Scottish local elections on 3 May 2007. This is because STV has an element of proportionality which is not present unless multiple seats are being elected. This may differ from other published sources showing gain/loss relative to seats held at dissolution of Scotland's councils.
By-election changes prior to 2012 dissolution
Between 2007 and 2012 the following changes took place:
- SNP gain 1 seat in Blantyre from Independent
- Labour gain 1 seat in Cambuslang East from SNP
- Labour gain 1 seat in Blantyre from SNP
- SNP gain 1 seat in Hamilton West and Earnock from Independent
- Independent gain 1 seat in Avondale and Stonehouse from Conservative
Ward results
Clydesdale West
- 2007: 2xSNP; 1xLab; 1xCon
- 2012: 2xLab; 2xSNP
- 2007-2012 Change: Lab gain one seat from Con
| Clydesdale West - 4 seats | |||||||||||||
|---|---|---|---|---|---|---|---|---|---|---|---|---|---|
| Party | Candidate | FPv% | Count 1 | Count 2 | Count 3 | Count 4 | Count 5 | Count 6 | Count 7 | Count 8 | Count 9 | ||
| Labour | Eileen Logan (incumbent) | 29.12 | 1,687 | ||||||||||
| SNP | David Shearer (incumbent) | 19.83 | 1,149 | 1,180.3 | |||||||||
| SNP | Pat Lee†††††††† | 15.90 | 921 | 943.8 | 959.5 | 977.3 | 989.2 | 1,000.4 | 1,023.1 | 1094.1 | 1,247.7 | ||
| Labour | Lynsey Hamilton | 15.14 | 877 | 1,279.5 | |||||||||
| Conservative | Alex Allison (incumbent) | 11.12 | 644 | 653.1 | 661.7 | 662.4 | 673.7 | 700.3 | 727.8 | 798.7 | |||
| Independent | Duncan McFarlane | 4.25 | 246 | 258.2 | 268.6 | 269.2 | 283.6 | 316.9 | 352.6 | ||||
| Liberal Democrats | Peter Charles Meehan | 2.18 | 126 | 136.3 | 143.4 | 143.8 | 148.7 | 149.8 | |||||
| UKIP | Neil MacLeod | 1.35 | 78 | 81.8 | 85.6 | 85.8 | 95.7 | ||||||
| Scottish Christian | Robin Mawhinney | 1.12 | 65 | 69.4 | 73.6 | 73.8 | |||||||
| Electorate: 14,923 Valid: 5,793 Spoilt: 92 Quota: 1,159 Turnout: 5,885 (38.82%) | |||||||||||||
Clydesdale North
- 2007: 1xSNP; 1xLab; 1xCon
- 2012: 1xLab; 1xSNP; 1xIndependent
- 2007-2012 Change: Independent gain one seat from Con
| Clydesdale North - 3 seats | ||||||||||
|---|---|---|---|---|---|---|---|---|---|---|
| Party | Candidate | FPv% | Count 1 | Count 2 | Count 3 | Count 4 | Count 5 | Count 6 | ||
| Labour | Catherine McClymont | 27.48 | 1,253 | |||||||
| SNP | Vivienne Shaw | 18.12 | 826 | 829.6 | 886.1 | 1318.1 | ||||
| Conservative | Patrick Ross-Taylor (incumbent) | 17.83 | 813 | 815.4 | 864.1 | 904.5 | 927.4 | |||
| Independent | Ed Archer | 15.99 | 729 | 734.4 | 836.3 | 873.8 | 933.3 | 1,405.5 | ||
| SNP | George Sutherland (incumbent) | 11.41 | 520 | 522.3 | 551.7 | |||||
| Labour | Gordon Muir | 9.17 | 418 | 510.8 | ||||||
| Electorate: 11,747 Valid: 4,559 Spoilt: 92 Quota: 1,140 Turnout: 4,651 (38.81%) | ||||||||||
Clydesdale East
- 2007: 2xCon; 1xSNP
- 2012: 1xSNP; 1xCon; 1xLab
- 2007-2012 Change: Lab gain one seat from Con
| Clydesdale East - 3 seats | ||||||||||
|---|---|---|---|---|---|---|---|---|---|---|
| Party | Candidate | FPv% | Count 1 | Count 2 | Count 3 | Count 4 | Count 5 | Count 6 | ||
| SNP | Bev Gauld (incumbent)††† | 22.29 | 936 | 981 | 1,013 | 1,069.9 | ||||
| Conservative | Hamish Stewart (incumbent) | 19.81 | 832 | 882 | 1,453 | |||||
| SNP | Ian Donald McAllan | 17.74 | 745 | 783 | 810 | 849.8 | 863.9 | |||
| Labour | Ralph Barker | 17.31 | 727 | 794 | 824 | 875.5 | 877.2 | 1,120.4 | ||
| Conservative | John McLatchie | 16.48 | 692 | 713 | ||||||
| Scottish Green | Janet Moxley | 6.38 | 268 | |||||||
| Electorate: 9,815 Valid: 4,200 Spoilt: 65 Quota: 1,051 Turnout: 4,265 (42.79%) | ||||||||||
Clydesdale South
- 2007: 2xLab; 1xSNP
- 2012: 2xLab; 1xSNP
- 2007-2012 Change: No change
| Clydesdale South - 3 seats | ||||||||||
|---|---|---|---|---|---|---|---|---|---|---|
| Party | Candidate | FPv% | Count 1 | Count 2 | Count 3 | Count 4 | Count 5 | Count 6 | ||
| SNP | Archie Manson (incumbent)†††††† | 34.96 | 1,625 | |||||||
| Labour | George Greenshields | 24.72 | 1,149 | 1,170.3 | ||||||
| Labour | Alex McInnes (incumbent) | 18.83 | 875 | 888.6 | 893.8 | 921.4 | 1044.4 | 1,250.6 | ||
| Conservative | Colin McGavigan | 10.48 | 487 | 494.1 | 494.3 | 561.7 | ||||
| SNP | Tom McDonald | 6.73 | 313 | 703.9 | 704.4 | 736.4 | 852 | |||
| UKIP | Chris McEwan | 4.28 | 199 | 206.7 | 206.9 | |||||
| Electorate: 11,620 Valid: 4,648 Spoilt: 113 Quota: 1,163 Turnout: 4,761 (40.0%) | ||||||||||
Avondale and Stonehouse
- 2007: 1xSNP; 1xCon; 1xLab; 1xIndependent
- 2012: 2xSNP; 1xLab; 1xIndependent
- 2007-2012 Change: SNP gain one seat from Con
| Avondale and Stonehouse - 4 seats | |||||||||||||||
|---|---|---|---|---|---|---|---|---|---|---|---|---|---|---|---|
| Party | Candidate | FPv% | Count 1 | Count 2 | Count 3 | Count 4 | Count 5 | Count 6 | Count 7 | Count 8 | Count 9 | Count 10 | Count 11 | ||
| SNP | Isobel Dorman | 21.40 | 1,148 | ||||||||||||
| SNP | William Holman (incumbent) | 16.14 | 866 | 922.7 | 931.8 | 949.8 | 992.8 | 1,061.3 | 1,162.6 | ||||||
| Labour | Margaret Cooper | 12.49 | 670 | 673.1 | 674.1 | 685.2 | 698.3 | 732.3 | 759.3 | 764 | 1,158.8 | ||||
| Conservative | Allan Finnie | 11.63 | 624 | 625.4 | 634.5 | 641.6 | 649.6 | 666.6 | 718.7 | 724.5 | 734.7 | 739.4 | |||
| Independent | Graeme Campbell (incumbent) | 9.36 | 502 | 503.2 | 505.2 | 516.4 | 525.4 | 580.6 | 808 | 823.5 | 853 | 861.9 | 1,100.3 | ||
| Labour | John Hamilton | 9.21 | 494 | 494.9 | 494.9 | 498.2 | 521.2 | 564.2 | 588.3 | 596.6 | |||||
| Independent | Lynn Filshie (incumbent) | 7.62 | 409 | 411.6 | 417.6 | 428.7 | 459.7 | 554.8 | |||||||
| Independent | Jim Malloy (incumbent) | 6.32 | 339 | 340.4 | 340.4 | 357.4 | 380.5 | ||||||||
| Scottish Green | Erica Young | 3.37 | 181 | 183 | 185.1 | 189.2 | |||||||||
| Independent | Kenny Weir | 1.75 | 94 | 96.4 | 99.4 | ||||||||||
| UKIP | Melvyn Donald Randall | 0.69 | 37 | 37.4 | |||||||||||
| Electorate: 12,848 Valid: 5,364 Spoilt: 97 Quota: 1,073 Turnout: 5,461 (41.75%) | |||||||||||||||
East Kilbride South
- 2007: 2xSNP; 1xLab
- 2012: 2xSNP; 1xLab
- 2007-2012 Change: No change
| East Kilbride South - 3 seats | |||||||||
|---|---|---|---|---|---|---|---|---|---|
| Party | Candidate | FPv% | Count 1 | Count 2 | Count 3 | Count 4 | Count 5 | ||
| SNP | Archie Buchanan (incumbent) | 40.74 | 1,725 | ||||||
| Labour | Jim Docherty (incumbent) | 28.43 | 1,203 | ||||||
| SNP | Douglas Edwards (incumbent) | 11.22 | 475 | 1,020.9 | 1,029.3 | 1,038.7 | 1,061.1 | ||
| Labour | Patrick Quigg | 8.01 | 339 | 377.6 | 489.4 | 499.7 | 514 | ||
| East Kilbride Alliance | Colin McKay | 4.56 | 193 | 214.6 | 219.2 | 225.7 | 242.1 | ||
| Conservative | Patricia Harrow | 3.40 | 144 | 150.9 | 153.8 | 162.9 | 167.9 | ||
| Solidarity | John Park. | 2.72 | 115 | 123.9 | 126.4 | 128.4 | |||
| Liberal Democrats | Douglas Herbison | 0.94 | 40 | 45.8 | 47.6 | ||||
| Electorate: 11,537 Valid: 4,234 Spoilt: 91 Quota: 1,059 Turnout: 4,325 (36.7%) | |||||||||
East Kilbride Central South
- 2007: 2xLab; 1xSNP
- 2012: 2xLab; 1xSNP
- 2007-2012 Change: No change
| East Kilbride Central South - 3 seats | ||||||||||
|---|---|---|---|---|---|---|---|---|---|---|
| Party | Candidate | FPv% | Count 1 | Count 2 | Count 3 | Count 4 | Count 5 | Count 6 | ||
| SNP | John Anderson (incumbent) | 38.04 | 1,721 | |||||||
| Labour | Gerry Convery (incumbent) | 35.32 | 1,598 | |||||||
| Labour | Susan Kerr | 12.84 | 581 | 613.5 | 1,011.9 | 1,044 | 1,107.8 | 1,306.2 | ||
| SNP | Duncan McLean | 6.76 | 306 | 795.1 | 804.4 | 826.4 | 860.4 | |||
| Conservative | Isabel Perratt | 4.93 | 223 | 231.9 | 236.6 | 254.2 | ||||
| Liberal Democrats | Alasdair Sutherland | 2.10 | 95 | 105.9 | 114.9 | |||||
| Electorate: 10,854 Valid: 4,524 Spoilt: 133 Quota: 1,132 Turnout: 4,657 (41.68%) | ||||||||||
East Kilbride Central North
- 2007: 2xLab; 2xSNP
- 2012: 2xLab; 2xSNP
- 2007-2012 Change: No change
| East Kilbride Central North - 4 seats | ||||||||||||
|---|---|---|---|---|---|---|---|---|---|---|---|---|
| Party | Candidate | FPv% | Count 1 | Count 2 | Count 3 | Count 4 | Count 5 | Count 6 | Count 7 | Count 8 | ||
| SNP | Anne Maggs (incumbent) | 29.31 | 1,733 | |||||||||
| Labour | Alice Marie Mitchell (incumbent) | 22.80 | 1,348 | |||||||||
| Labour | Christopher Thompson (incumbent) | 18.01 | 1,065 | 1,100.9 | 1,230.6 | |||||||
| SNP | Sheena Wardhaugh (incumbent) | 9.28 | 549 | 972.7 | 977.8 | 983.7 | 993.5 | 1,064.8 | 1,115.3 | 1,374.4 | ||
| Scottish Green | Kirsten Robb | 8.73 | 516 | 560.7 | 571 | 579.6 | 598.7 | 715.2 | 819.6 | |||
| Conservative | William Chalmers | 6.33 | 374 | 378.4 | 380.8 | 383.2 | 386.3 | 412.4 | ||||
| East Kilbride Alliance | Clare Keane | 4.68 | 277 | 287.2 | 290.7 | 293.3 | 302.5 | |||||
| Solidarity | Richard Foster | 0.86 | 51 | 53.2 | 53.6 | 55.4 | ||||||
| Electorate: 14,005 Valid: 5,913 Spoilt: 104 Quota: 1,183 Turnout: 6,017 (42.22%) | ||||||||||||
East Kilbride West
- 2007: 1xSNP; 1xLab; 1xCon
- 2012: 1xCon; 1xSNP; 1xLab
- 2007-2012 Change: No change
| East Kilbride West - 3 seats | ||||||||||
|---|---|---|---|---|---|---|---|---|---|---|
| Party | Candidate | FPv% | Count 1 | Count 2 | Count 3 | Count 4 | Count 5 | Count 6 | ||
| Conservative | Graham Simpson (incumbent) | 25.25 | 1,197 | |||||||
| SNP | David Watson(incumbent) | 24.22 | 1,148 | 1,150.1 | 1,188.4 | |||||
| Labour | Janice McGinlay | 16.98 | 805 | 806 | 849.3 | 849.3 | 974.7 | 1,740.9 | ||
| Labour | Alan Scott (incumbent) | 16.88 | 800 | 801.4 | 822.6 | 822.7 | 916 | |||
| SNP | John Reilly | 12.22 | 579 | 579.5 | 604.6 | 606.5 | ||||
| East Kilbride Alliance | Brian Jones | 4.45 | 211 | 213.1 | ||||||
| Electorate: 12,092 Valid: 4,740 Spoilt: 44 Quota: 1,186 Turnout: 4,784 (39.20%) | ||||||||||
East Kilbride East
- 2007: 2xLab; 1xSNP
- 2012: 2xSNP; 1xLab
- 2007-2012 Change: SNP gain one seat from Lab
| East Kilbride East - 3 seats | |||||||||
|---|---|---|---|---|---|---|---|---|---|
| Party | Candidate | FPv% | Count 1 | Count 2 | Count 3 | Count 4 | Count 5 | ||
| Labour | John Cairney (incumbent) | 27.37 | 1,037 | ||||||
| SNP | Jim Wardhaugh (incumbent) | 22.51 | 853 | 855.3 | 866.6 | 912.7 | 1,030.9 | ||
| SNP | Gladys Miller | 20.98 | 795 | 798.4 | 818.5 | 862.8 | 976.9 | ||
| Labour | Graham Scott (incumbent) | 17.71 | 671 | 746.2 | 765.6 | 837.3 | |||
| Conservative | Ian Harrow | 8.47 | 321 | 322.9 | 356.9 | ||||
| Liberal Democrats | Nigel Benzies | 2.96 | 112 | 113.2 | |||||
| Electorate: 9,622 Valid: 3,789 Spoilt: 72 Quota: 948 Turnout: 3,861 (39.38%) | |||||||||
Rutherglen South
- 2007: 1xLab; 1xLib Dem; 1xSNP
- 2012: 1xLab; 1xLib Dem; 1xSNP
- 2007-2012 Change: No change
| Rutherglen South - 3 seats | |||||||||
|---|---|---|---|---|---|---|---|---|---|
| Party | Candidate | FPv% | Count 1 | Count 2 | Count 3 | Count 4 | Count 5 | ||
| Labour | Brian McKenna (incumbent) | 26.03 | 1,244 | ||||||
| Liberal Democrats | Robert Brown | 24.71 | 1,181 | 1,185.3 | 1,213.4 | ||||
| SNP | Anne Higgins (incumbent)† | 23.88 | 1,141 | 1,143.4 | 1,151.4 | 1,156.2 | 1,198.7 | ||
| Labour | Gerard Killen | 17.81 | 851 | 887.7 | 914.2 | 918.1 | 971.5 | ||
| Conservative | Richard Tawse | 4.85 | 232 | 232.5 | 268.6 | 272.1 | |||
| Scottish Unionist | Michael Haigh | 2.72 | 130 | 130.7 | |||||
| Electorate: 11,153 Valid: 4,779 Spoilt: 72 Quota: 1,195 Turnout: 4,851 (42.85%) | |||||||||
Rutherglen Central and North
- 2007: 2xLab; 1xSNP
- 2012: 2xLab; 1xSNP
- 2007-2012 Change: No change
| Rutherglen Central and North - 3 seats | |||||||
|---|---|---|---|---|---|---|---|
| Party | Candidate | FPv% | Count 1 | Count 2 | Count 3 | ||
| Labour | Edward McAvoy (incumbent) | 40.77 | 1,571 | ||||
| SNP | Gordon Clark (incumbent) | 23.41 | 902 | 928.3 | 973.8 | ||
| Labour | Denis McKenna (incumbent) | 20.17 | 777 | 1,300.1 | |||
| Conservative | Jean Miller | 5.19 | 200 | 204.6 | 218.9 | ||
| SNP | Michael Hanley | 4.10 | 158 | 163.4 | 175.5 | ||
| Scottish Unionist | Jim Nixon | 3.84 | 148 | 152.3 | 165.9 | ||
| Liberal Democrats | Tunweer Malik | 2.52 | 97 | 103.6 | 128.1 | ||
| Electorate: 10,280 Valid: 3,853 Spoilt: 113 Quota: 964 Turnout: 3,966 (37.48%) | |||||||
Cambuslang West
- 2007: 1xLab; 1xSNP; 1xLib Dem
- 2012: 2xLab; 1xSNP
- 2007-2012 Change: Lab gain one seat from Lib Dem
| Cambuslang West - 3 seats | ||||||||||
|---|---|---|---|---|---|---|---|---|---|---|
| Party | Candidate | FPv% | Count 1 | Count 2 | Count 3 | Count 4 | Count 5 | Count 6 | ||
| Labour | Russell Clearie (incumbent) | 34.67 | 1,669 | |||||||
| SNP | Clare McColl (incumbent) | 26.17 | 1,260 | |||||||
| Liberal Democrats | David Baillie (incumbent) | 14.69 | 707 | 752.9 | 762.3 | 835.6 | 1,048.3 | |||
| Labour | Richard Tullett * | 12.59 | 606 | 949.8 | 960.8 | 1,029.6 | 1,065.3 | 1,394.5 | ||
| Conservative | James MacKay | 7.15 | 344 | 355.6 | 357.8 | 387.8 | ||||
| Scottish Green | Janice Sharkey | 4.74 | 228 | 244.9 | 260.1 | |||||
| Electorate: 11,948 Valid: 4,814 Spoilt: 81 Quota: 1,204 Turnout: 4,895 (40.29%) | ||||||||||
- = Sitting Councillor for a different Ward.
Cambuslang East
- 2007: 2xLab; 1xSNP
- 2012: 2xLab; 1xSNP
- 2007-2012 Change: No change
| Cambuslang East - 3 seats | |||||||
|---|---|---|---|---|---|---|---|
| Party | Candidate | FPv% | Count 1 | Count 2 | Count 3 | ||
| Labour | Walter Brogan (incumbent) | 43.04 | 1,554 | ||||
| SNP | Christine Deanie | 23.40 | 845 | 875.6 | 925.4 | ||
| Labour | Pam Clearie (incumbent) | 17.47 | 631 | 1,176.8 | |||
| SNP | Alistair Fulton | 8.61 | 311 | 326.1 | 340 | ||
| Conservative | Alan Fraser | 5.26 | 190 | 195 | 210.7 | ||
| Liberal Democrats | Lindsay Watt | 2.22 | 80 | 91.7 | 118 | ||
| Electorate: 11,090 Valid: 3,611 Spoilt: 103 Quota: 903 Turnout: 3,714 (32.56%) | |||||||
Blantyre
- 2007: 2xLab; 1xIndependent; 1xSNP
- 2012: 3xLab; 1xSNP
- 2007-2012 Change: Lab gain one seat from Independent
| Blantyre - 4 seats | ||||||||||||||
|---|---|---|---|---|---|---|---|---|---|---|---|---|---|---|
| Party | Candidate | FPv% | Count 1 | Count 2 | Count 3 | Count 4 | Count 5 | Count 6 | Count 7 | Count 8 | Count 9 | Count 10 | ||
| Labour | Hugh Dunsmuir (incumbent) | 25.04 | 1,144 | |||||||||||
| SNP | Bert Thomson (incumbent)††††† | 20.33 | 929 | |||||||||||
| Labour | Jim Handibode (incumbent)††††††††† | 16.55 | 756 | 935.7 | ||||||||||
| Labour | John McNamee (incumbent) | 12.67 | 579 | 600.9 | 616.9 | 617.4 | 621.4 | 626.2 | 638.7 | 686.5 | 751.7 | 843.7 | ||
| SNP | John Mullen | 10.29 | 470 | 472.2 | 472.7 | 484.2 | 485.7 | 489.8 | 511.9 | 541.9 | 580.8 | |||
| Independent | Michael Martin | 5.12 | 234 | 238.2 | 238.9 | 239.4 | 241.4 | 259.7 | 297 | 348.4 | ||||
| Christian Peoples Alliance | Michael McGlynn | 4.57 | 209 | 212 | 213.2 | 213.6 | 213.6 | 216.9 | 253.2 | |||||
| Conservative | Isobel Black | 3.85 | 176 | 179 | 179.4 | 179.7 | 187.7 | 190.8 | ||||||
| Independent | Gavin Wallace | 0.88 | 40 | 41.4 | 41.6 | 41.9 | 45 | |||||||
| Liberal Democrats | Mike Watson | 0.70 | 32 | 33 | 33.1 | 33.2 | ||||||||
| Electorate: 13,021 Valid: 4,569 Spoilt: 135 Quota: 914 Turnout: 4,704 (35.09%) | ||||||||||||||
Bothwell and Uddingston
- 2007: 1xCon; 1xLab; 1xSNP
- 2012: 1xSNP; 1xLab; 1xCon
- 2007-2012 Change: No change
| Bothwell and Uddingston - 3 seats | ||||||
|---|---|---|---|---|---|---|
| Party | Candidate | FPv% | Count 1 | Count 2 | ||
| SNP | Jim McGuigan (incumbent) | 35.22 | 1,342 | |||
| Labour | Maureen Devlin (incumbent) | 29.50 | 1,124 | |||
| Conservative | Anne Kegg | 23.78 | 906 | 1,000.5 | ||
| Labour | Patrick Morgan | 11.50 | 438 | 550.8 | ||
| Electorate: 9,525 Valid: 3,810 Spoilt: 59 Quota: 953 Turnout: 3,869 (40.00%) | ||||||
Hamilton North and East
- 2007: 2xLab; 1xSNP
- 2012: 2xLab; 1xSNP
- 2007-2012 Change: No change
| Hamilton North and East - 3 seats | ||||||||||
|---|---|---|---|---|---|---|---|---|---|---|
| Party | Candidate | FPv% | Count 1 | Count 2 | Count 3 | Count 4 | Count 5 | Count 6 | ||
| Labour | Davie McLachlan(incumbent) | 24.37 | 1,037 | 1,045 | 1,073 | |||||
| SNP | Lynn Adams †††††††††† | 22.20 | 945 | 964 | 994 | 994.3 | 1,044.3 | 1,726.4 | ||
| Labour | Monica Lennon | 18.66 | 794 | 808 | 827 | 833.5 | 892.5 | 944.7 | ||
| SNP | Barry Douglas (incumbent) | 18.23 | 776 | 792 | 803 | 803.4 | 862.4 | |||
| Conservative | Margaret Murray | 10.10 | 430 | 448 | 471 | 471.2 | ||||
| Independent | Balarabe Baba | 3.31 | 141 | 170 | ||||||
| Scottish Green | Alasdair Duke | 3.13 | 133 | |||||||
| Electorate: 12,361 Valid: 4,256 Spoilt: 112 Quota: 1,065 Turnout: 4,368 (34.43%) | ||||||||||
Hamilton West and Earnock
- 2007: 2xLab; 1xSNP; 1xIndependent
- 2012: 2xLab; 2xSNP
- 2007-2012 Change: SNP gain one seat from Independent
| Hamilton West and Earnock - 4 seats | |||||||
|---|---|---|---|---|---|---|---|
| Party | Candidate | FPv% | Count 1 | Count 2 | Count 3 | ||
| Labour | Allan Falconer (incumbent) | 27.28 | 1,170 | ||||
| SNP | Graeme Horne (incumbent) | 26.88 | 1,153 | ||||
| Labour | Jean McKeown (incumbent) | 20.07 | 861 | ||||
| SNP | John Menzies (incumbent) | 13.80 | 592 | 639.9 | 887.7 | ||
| Conservative | Connar McBain | 8.60 | 369 | 387.1 | 395.6 | ||
| Liberal Democrats | McKenzie Gibson | 1.73 | 74 | 101.9 | 107.9 | ||
| UKIP | Rob Sale | 1.63 | 70 | 94.8 | 98.6 | ||
| Electorate: 13,853 Valid: 4,289 Spoilt: 77 Quota: 858 Turnout: 4,366 (30.96%) | |||||||
Hamilton South
- 2007: 2xLab; 1xSNP; 1xCon
- 2012: 2xLab; 2xSNP
- 2007-2012 Change: SNP gain one seat from Con
| Hamilton South - 4 seats | |||||||||||
|---|---|---|---|---|---|---|---|---|---|---|---|
| Party | Candidate | FPv% | Count 1 | Count 2 | Count 3 | Count 4 | Count 5 | Count 6 | Count 7 | ||
| Labour | Joe Lowe (incumbent) | 36.6 | 1,975 | ||||||||
| SNP | Angela Crawley††††††† | 23.2 | 1,255 | ||||||||
| Labour | Brian McCaig (incumbent) | 14.8 | 800 | 1,512.3 | |||||||
| SNP | Bobby Lawson (incumbent)†† | 9.3 | 502 | 537.4 | 598.9 | 746.5 | 773.4 | 861.1 | 988.3 | ||
| Conservative | John Murray (incumbent) | 9.2 | 496 | 515.9 | 542.3 | 544.5 | 583.9 | 653.6 | |||
| Scottish Senior Citizens | David Holland | 3.7 | 199 | 233.9 | 313.7 | 323.5 | 379.8 | ||||
| Scottish Christian | Craig Smith | 3.1 | 165 | 175.9 | 197.5 | 200.3 | |||||
| Electorate: 14,383 Valid: 5,392 Spoilt: 134 Quota: 1,079 Turnout: 5,526 (37.49%) | |||||||||||
Larkhall
- 2007: 2xLab; 2xSNP
- 2012: 2xLab; 2xSNP
- 2007-2012: No change
| Larkhall - 4 seats | |||||||
|---|---|---|---|---|---|---|---|
| Party | Candidate | FPv% | Count 1 | Count 2 | Count 3 | ||
| Labour | Jackie Burns (incumbent) | 37.42 | 1,965 | ||||
| SNP | Peter Craig (incumbent) | 21.41 | 1,124 | ||||
| SNP | Lesley McDonald (incumbent)†††† | 18.24 | 958 | 1,009.6 | 1,102.4 | ||
| Labour | Andy Carmichael (incumbent) | 14.32 | 752 | 1,506.9 | |||
| Conservative | David Murray | 6.11 | 321 | 333.6 | 363.4 | ||
| UKIP | Donald Murdo MacKay | 2.50 | 131 | 140.8 | 176.5 | ||
| Electorate: 14,510 Valid: 5,251 Spoilt: 106 Quota: 1,051 Turnout: 5,357 (36.19%) | |||||||
Changes since last election
- † Rutherglen South SNP Cllr Anne Higgins died on 20 November 2012. A by-election was held on 14 February 2013 and was won by Labour's Gerard Killen which gave the party an overall majority on the Council.[2]
- †† Hamilton South SNP Cllr Bobby Lawson died on 13 August 2013. A by-election was held on 24 October 2013 and was won by the Labour Party's Stuart Gallacher.[3]
- ††† Clydesdale East SNP Cllr Reverend Bev Gauld resigned from the party and became an Independent after the party legalised same-sex marriage[4]
- †††† Larkhall SNP Cllr Lesley McDonald defected from the SNP and joined the Labour Party on 2 May 2014.[5]
- ††††† Blantyre SNP Cllr Bert Thomson defected from the SNP and joined the Labour Party in 2014.
- †††††† Clydesdale South SNP Cllr Archie Manson resigned on 14 March 2014 on health grounds. The by-election was won by the Labour Party's Gordon Muir on 5 June 2014.[6]
- ††††††† Hamilton South SNP Cllr Angela Crawley was elected as an MP for Lanark and Hamilton East on 7 May 2015. She resigned her Council seat on 22 May 2015.[7] A by-election was held to fill the vacancy on 6 August 2015 and it was won by the SNP's John Ross.
- †††††††† Clydesdale West SNP Cllr Pat Lee defected from the SNP and joined Solidarity on 27 May 2015.[8]
- ††††††††† Blantyre Labour Party Cllr Jim Handibode died on 19 September 2015.[9] A by-election was held to fill the vacancy on 10 December 2015 and was won by Labour's Mo Razzaq.
- †††††††††† Hamilton North and East SNP Cllr Lynn Adams died on 21 September 2015.[10] A by-election was held on 21 January 2016 to fill the vacancy and it was won by the party's Stephanie Callaghan.
By-elections since 2012
| Rutherglen South By-election (14 February 2013) [11]- 1 Seat | |||||||||||
|---|---|---|---|---|---|---|---|---|---|---|---|
| Party | Candidate | FPv% | Count 1 | Count 2 | Count 3 | Count 4 | Count 5 | Count 6 | Count 7 | ||
| Labour | Gerard Killen | 39.86% | 1,352 | 1,358 | 1,370 | 1,376 | 1,396 | 1,616 | 2,090 | ||
| Liberal Democrats | David Baillie | 29.45% | 999 | 1,004 | 1,016 | 1,035 | 1,104 | 1,278 | |||
| SNP | Margaret Ferrier | 20.99% | 712 | 714 | 730 | 741 | 755 | ||||
| Conservative | Aric Gilinisky | 3.77% | 128 | 133 | 134 | 170 | |||||
| UKIP | Donald Murdo MacKay | 3.27% | 111 | 115 | 120 | ||||||
| Scottish Green | Susan Martin | 1.74% | 59 | 60 | |||||||
| Independent | Craig Smith | 0.91% | 31 | ||||||||
| Electorate: Valid: 3,392 Spoilt: 46 (1.34%) Quota: 1,697 Turnout: 3,438 (26.61%) | |||||||||||
| Hamilton South By-election (24 October 2013) [12]- 1 Seat | |||||
|---|---|---|---|---|---|
| Party | Candidate | FPv% | Count 1 | ||
| Labour | Stuart Gallacher | 51.7% | 1,781 | ||
| SNP | Josh Wilson | 32.5% | 1,120 | ||
| Conservative | Lynne Nailon | 9.4% | 322 | ||
| Scottish Christian | Craig Martin | 3.9% | 133 | ||
| UKIP | Josh Richardson | 2.5% | 86 | ||
| Electorate: Valid: 3,442 Spoilt: 43 Quota: 1,722 Turnout: 3,485 | |||||
| Clydesdale South By-election (5 June 2014) [13]- 1 Seat | |||||||||
|---|---|---|---|---|---|---|---|---|---|
| Party | Candidate | FPv% | Count 1 | Count 2 | Count 3 | Count 4 | Count 5 | ||
| Labour | Gordon Muir | 40.8% | 1,492 | 1,512 | 1,559 | 1,819 | 2,366 | ||
| SNP | George Sneddon | 32.0% | 1,170 | 1,203 | 1,260 | 1,356 | |||
| Conservative | Donna Hood | 18.0% | 659 | 674 | 744 | ||||
| UKIP | Donald MacKay | 6.4% | 233 | 247 | |||||
| Scottish Green | Ruth Thomas | 2.8% | 104 | ||||||
| Electorate: Valid: 3,658 Spoilt: 52 Quota: 1,830 Turnout: 3,710 (30.97%) | |||||||||
| Hamilton South By-election (6 August 2015)- 1 Seat[14] | ||||||||||
|---|---|---|---|---|---|---|---|---|---|---|
| Party | Candidate | FPv% | Count 1 | Count 2 | Count 3 | Count 4 | Count 5 | Count 6 | ||
| SNP | John Ross | 48.0 | 1881 | 1883 | 1888 | 1905 | 1919 | 1988 | ||
| Labour | Jim Lee | 35.6 | 1396 | 1398 | 1405 | 1410 | 1425 | 1460 | ||
| Conservative | Lynne Nailon | 8.9 | 349 | 349 | 354 | 365 | 389 | 394 | ||
| Scottish Green | John Kane | 3.2 | 127 | 128 | 132 | 135 | 146 | |||
| Scottish Christian | Craig Smith | 2.0 | 77 | 80 | 81 | 84 | ||||
| UKIP | Donald Murdo MacKay | 1.1 | 43 | 44 | 45 | |||||
| Liberal Democrats | Matthew Cockburn | 0.82 | 32 | 34 | ||||||
| Pirate | Andrew McCallum | 0.33 | 13 | |||||||
| Electorate: 14811 Valid: 3918 Spoilt: 52 Quota: 1960 Turnout: 3970 (26.8%) | ||||||||||
| Blantyre By-election (10 December 2015) - 1 Seat[15] | |||||||||
|---|---|---|---|---|---|---|---|---|---|
| Party | Candidate | FPv% | Count 1 | Count 2 | Count 3 | Count 4 | Count 5 | ||
| Labour | Mo Razzaq | 47.2 | 1,476 | 1,483 | 1,504 | 1,536 | 1,589 | ||
| SNP | Gerry Chambers | 39.6 | 1,236 | 1,246 | 1,259 | 1,314 | 1,327 | ||
| Conservative | Taylor Muir | 4.5 | 140 | 156 | 172 | 173 | |||
| Scottish Socialist | Sean Baillie[16] | 3.9 | 122 | 125 | 133 | ||||
| Liberal Democrats | Stephen Reid | 2.9 | 92 | 97 | |||||
| UKIP | Emma Jay Docherty | 1.9 | 59 | ||||||
| Electorate: 13,745 Valid: 3,125 Spoilt: 45 Quota: 1,563 Turnout: 3,170 (23.1%) | |||||||||
| Hamilton North and East By-election (January 21 2016) - 1 Seat[17] | |||||||||
|---|---|---|---|---|---|---|---|---|---|
| Party | Candidate | FPv% | Count 1 | Count 2 | Count 3 | Count 4 | Count 5 | ||
| SNP | Stephanie Callaghan | 42.9% | 1,089 | 1,096 | 1,138 | 1,206 | 1,569 | ||
| Labour | Lyndsay Clelland | 33.6% | 855 | 861 | 878 | 1,052 | |||
| Conservative | James MacKay | 18.5% | 469 | 480 | 485 | ||||
| Scottish Green | Steven Hannigan | 3.3% | 83 | 90 | |||||
| Liberal Democrats | Norman Rae | 1.8% | 45 | ||||||
| Electorate: 12,423 Valid: 2,541 Spoilt: 31 Quota: 1,271 Turnout: 2,572 (20.2%) | |||||||||
References
- https://www.bbc.co.uk/news/uk-scotland-scotland-politics-21473487
- "Archived copy". Archived from the original on 2013-10-29. Retrieved 2013-10-25.CS1 maint: archived copy as title (link)
- "Archived copy". Archived from the original on 2013-10-29. Retrieved 2013-10-25.CS1 maint: archived copy as title (link)
- http://www.carlukegazette.co.uk/news/local-headlines/councillor-bev-gauld-resigns-from-snp-1-3303340
- http://www.dailyrecord.co.uk/news/local-news/larkhall-snp-councillor-lesley-mcdonald-3483752
- http://www.claudiabeamish.com/?p=2706
- https://www.facebook.com/pages/Solidarity-Scotland/156108464538212
- "Archived copy". Archived from the original on 2015-12-08. Retrieved 2015-09-22.CS1 maint: archived copy as title (link)
- "Archived copy". Archived from the original on 2013-10-29. Retrieved 2013-10-25.CS1 maint: archived copy as title (link)
- "Archived copy". Archived from the original on 2015-12-08. Retrieved 2015-11-28.CS1 maint: archived copy as title (link)
- "Archived copy". Archived from the original on 2016-03-04. Retrieved 2015-11-28.CS1 maint: archived copy as title (link)
- "Archived copy". Archived from the original on 2016-04-28. Retrieved 2015-08-07.CS1 maint: archived copy as title (link)
- "Archived copy". Archived from the original on 2015-12-14. Retrieved 2015-12-11.CS1 maint: archived copy as title (link)
- "Scottish Socialists Stand in Blantyre – SAVE OUR SERVICES". 9 November 2015. Retrieved 15 November 2015.
- http://www.southlanarkshire.gov.uk/press/article/1473/hamilton_north_and_east_by_election
http://www.andrewteale.me.uk/pdf/2012/s-lanarks12.pdf