2012 Wakefield Metropolitan District Council election
The 2012 Wakefield Metropolitan District Council election was held on 3 May 2012 to elect members of Wakefield Metropolitan District Council in West Yorkshire, England. One third of the council was up for election.
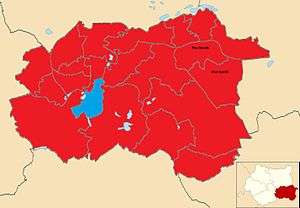
2012 local election results in Wakefield
Council Make-up
The make up of the Council after the election was:
| Party | Seats | Current Council (2012) | |||||||||||||||||||||||||||||||||||||||||||||||||||||||||||||||||
|---|---|---|---|---|---|---|---|---|---|---|---|---|---|---|---|---|---|---|---|---|---|---|---|---|---|---|---|---|---|---|---|---|---|---|---|---|---|---|---|---|---|---|---|---|---|---|---|---|---|---|---|---|---|---|---|---|---|---|---|---|---|---|---|---|---|---|---|
| 2010[1] | 2011[2] | 2012[3] | |||||||||||||||||||||||||||||||||||||||||||||||||||||||||||||||||
| Labour | 33 | 40 | 52 | ||||||||||||||||||||||||||||||||||||||||||||||||||||||||||||||||
| Conservative | 24 | 20 | 11 | ||||||||||||||||||||||||||||||||||||||||||||||||||||||||||||||||
| Independent | 5 | 3 | 0 | ||||||||||||||||||||||||||||||||||||||||||||||||||||||||||||||||
| Lib Dems | 1 | 0 | 0 | ||||||||||||||||||||||||||||||||||||||||||||||||||||||||||||||||
Election result
| Party | Seats | Gains | Losses | Net gain/loss | Seats % | Votes % | Votes | +/− | |
|---|---|---|---|---|---|---|---|---|---|
| Labour | 20 | 12 | 0 | +12 | 95 | 56.2 | 41,147 | +0.4 | |
| Conservative | 1 | 0 | 9 | -9 | 5 | 23.6 | 17,251 | -6.3 | |
| UKIP | 0 | 0 | 0 | 0 | 0 | 7.9 | 5,804 | +4.8 | |
| Independent | 0 | 0 | 3 | -3 | 0 | 6.5 | 4,746 | +3 | |
| Liberal Democrats | 0 | 0 | 0 | 0 | 0 | 3.3 | 2,424 | -1.7 | |
| Green | 0 | 0 | 0 | 0 | 0 | 1.1 | 801 | +0.2 | |
| English Democrat | 0 | 0 | 0 | 0 | 0 | 0.8 | 594 | +0.8 | |
| TUSC | 0 | 0 | 0 | 0 | 0 | 0.1 | 76 | -0.2 | |
- +/- compared with Wakefield Council election 2011.
Ward results
Ackworth, North Elmsall and Upton ward
| Party | Candidate | Votes | % | ± | |
|---|---|---|---|---|---|
| Labour | Martyn Ward | 2,128 | 62.4 | +10.2 | |
| Conservative | Don Marshall | 1,282 | 37.6 | +3 | |
| Majority | 846 | 24.8 | +7.1 | ||
| Turnout | 3,410 | 26.9 | -10.6 | ||
| Labour gain from Conservative | Swing | ||||
Airedale and Ferry Fryston ward
| Party | Candidate | Votes | % | ± | |
|---|---|---|---|---|---|
| Labour | Les Shaw | 1,977 | 73.3 | -6.8 | |
| UKIP | Arnie Craven | 556 | 20.4 | +20.4 | |
| Conservative | Mellisa Wan Omer | 171 | 6.3 | -12.9 | |
| Majority | 1,441 | 52.9 | -8 | ||
| Turnout | 2,724 | 23.5 | -4.7 | ||
| Labour hold | Swing | ||||
Altofts and Whitwood ward
| Party | Candidate | Votes | % | ± | |
|---|---|---|---|---|---|
| Labour | Peter Box | 2,009 | 61.6 | -2.5 | |
| UKIP | David Armitage | 783 | 24 | +24 | |
| Conservative | Steven Beeton | 470 | 14.4 | -10.7 | |
| Majority | 1,226 | 37.6 | -1.5 | ||
| Turnout | 3,262 | 25.8 | -6.4 | ||
| Labour hold | Swing | ||||
Castleford Central and Glasshoughton ward
| Party | Candidate | Votes | % | ± | |
|---|---|---|---|---|---|
| Labour | Mark Burns-Williamson | 2,306 | 76.3 | +2.1 | |
| UKIP | Alison Bullivant | 482 | 15.9 | +2.5 | |
| Conservative | Eamonn Mullins | 235 | 7.8 | -4.2 | |
| Majority | 1,824 | 60.3 | -0.5 | ||
| Turnout | 3,023 | 24.8 | |||
| Labour hold | Swing | ||||
Crofton, Ryhill and Walton ward
| Party | Candidate | Votes | % | ± | |
|---|---|---|---|---|---|
| Labour | Faith Hepptinstall | 2,582 | 67.3 | +6.1 | |
| Conservative | Allan Couch | 1,253 | 32.7 | +2.7 | |
| Majority | 1,329 | 34.7 | +3.5 | ||
| Turnout | 3,835 | 31.6 | -8.1 | ||
| Labour gain from Conservative | Swing | ||||
Featherstone ward
| Party | Candidate | Votes | % | ± | |
|---|---|---|---|---|---|
| Labour | June Cliffe | 2,649 | 83.7 | +21.4 | |
| Conservative | Charles Scholes | 516 | 16.3 | +4.4 | |
| Majority | 2,133 | 67.4 | +30.3 | ||
| Turnout | 3,165 | 34.8 | -9.6 | ||
| Labour hold | Swing | ||||
Hemsworth ward
| Party | Candidate | Votes | % | ± | |
|---|---|---|---|---|---|
| Labour | Shaun Hodson | 1,779 | 57.5 | -2 | |
| Independent | Jim Kenyon | 1,075 | 34.8 | +7.2 | |
| Conservative | Philip Davies | 238 | 7.7 | -4.3 | |
| Majority | 704 | 22.8 | -9.1 | ||
| Turnout | 3,092 | 25.7 | -7.2 | ||
| Labour gain from Independent | Swing | ||||
Horbury and South Ossett ward
| Party | Candidate | Votes | % | ± | |
|---|---|---|---|---|---|
| Labour | Jack Hemingway | 1,660 | 40.5 | -8.2 | |
| Conservative | Richard Wakefield | 934 | 22.8 | -18.2 | |
| Independent | Graham Jesty | 732 | 17.9 | +17.9 | |
| UKIP | Anthony Lumb | 429 | 10.5 | +10.5 | |
| Liberal Democrats | Mark Goodair | 340 | 8.3 | -1.2 | |
| Majority | 726 | 17.7 | +10 | ||
| Turnout | 4,095 | 33.9 | -7.5 | ||
| Labour gain from Independent | Swing | ||||
Knottingley ward
| Party | Candidate | Votes | % | ± | |
|---|---|---|---|---|---|
| Labour | Graham Stokes | 1,788 | 69.7 | +12.2 | |
| UKIP | Clinton Rhodes | 494 | 19.3 | +8.6 | |
| Conservative | Jon Wadey | 282 | 11 | -4.7 | |
| Majority | 1,294 | 50.5 | +8.7 | ||
| Turnout | 2,564 | 23.8 | -5.7 | ||
| Labour hold | Swing | ||||
Normanton ward
| Party | Candidate | Votes | % | ± | |
|---|---|---|---|---|---|
| Labour | Alan Wassell | 1,775 | 62.9 | -1 | |
| UKIP | Bryan Barkley | 712 | 25.2 | +7.9 | |
| Conservative | Emma-Jane Lisle | 337 | 11.9 | -6.4 | |
| Majority | 1,063 | 37.6 | -8 | ||
| Turnout | 2,824 | 22.3 | -6.2 | ||
| Labour hold | Swing | ||||
Ossett ward
| Party | Candidate | Votes | % | ± | |
|---|---|---|---|---|---|
| Labour | Tony Richardson | 1,991 | 49.2 | +8.9 | |
| Conservative | Terry Brown | 1,453 | 35.9 | -7.2 | |
| Liberal Democrats | David Smith | 606 | 15 | -0.8 | |
| Majority | 538 | 13.3 | |||
| Turnout | 4,050 | 31.9 | -7.8 | ||
| Labour gain from Conservative | Swing | ||||
Pontefract North ward
| Party | Candidate | Votes | % | ± | |
|---|---|---|---|---|---|
| Labour | Paula Sherriff | 1,649 | 47.9 | -11.9 | |
| Independent | Jack Kershaw | 769 | 22.3 | +22.3 | |
| Conservative | Hannah Crowther | 481 | 14 | -9.6 | |
| UKIP | Nathan Garbutt | 368 | 10.7 | 0 | |
| Green | Rennie Smith | 103 | 3.0 | -2.4 | |
| TUSC | Daniel Dearden | 76 | 2.2 | +2.2 | |
| Majority | 880 | 25.5 | -10.6 | ||
| Turnout | 3,446 | 28.1 | -3.1 | ||
| Labour gain from Conservative | Swing | ||||
Pontefract South
| Party | Candidate | Votes | % | ± | |
|---|---|---|---|---|---|
| Labour | Celia Loughran | 2,222 | 50.4 | -3.1 | |
| Conservative | Mark Crowther | 1,617 | 36.7 | -9.1 | |
| UKIP | Terence Edward Uttley | 446 | 10.1 | +10.1 | |
| Liberal Democrats | Doug Dale | 122 | 2.8 | -10.1 | |
| Majority | 605 | 13.7 | -6 | ||
| Turnout | 4,407 | 36.6 | -5.9 | ||
| Labour gain from Conservative | Swing | ||||
South Elmsall and South Kirkby ward
| Party | Candidate | Votes | % | ± | |
|---|---|---|---|---|---|
| Labour | Michelle Collins | 2,071 | 56.1 | -21.5 | |
| Independent | Wilf Benson | 1,425 | 38.6 | +38.6 | |
| Conservative | Christian IAnson | 197 | 5.3 | -6.8 | |
| Majority | 646 | 17.5 | -48 | ||
| Turnout | 3,693 | 27.4 | |||
| Labour gain from Independent | Swing | ||||
Stanley and Outwood East ward
| Party | Candidate | Votes | % | ± | |
|---|---|---|---|---|---|
| Labour | Matthew Morley | 2,135 | 61.4 | +6.1 | |
| Conservative | James Kildea | 971 | 27.9 | -8.1 | |
| Liberal Democrats | Margaret Dodd | 370 | 10.6 | +2.6 | |
| Majority | 1,164 | 33.5 | +14.2 | ||
| Turnout | 3,476 | 28.4 | -8.7 | ||
| Labour gain from Conservative | Swing | ||||
Wakefield East ward
| Party | Candidate | Votes | % | ± | |
|---|---|---|---|---|---|
| Labour | Ros Lund | 1,741 | 50.9 | +13.5 | |
| Independent | Choudry Ikram | 659 | 19.3 | +19.3 | |
| Conservative | Anthony Bracewell | 596 | 17.4 | -2.4 | |
| TUSC | Michael Griffiths | 327 | 9.9 | +0.9 | |
| Independent | Safia Ilyas | 86 | 2.5 | +2.5 | |
| Majority | 1,082 | 31.6 43.2 | -11.6 | ||
| Turnout | 3,419 | 28.6 33.6 | -5 | ||
| Labour hold | Swing | ||||
Wakefield North ward
| Party | Candidate | Votes | % | ± | |
|---|---|---|---|---|---|
| Labour | Elizabeth Rhodes | 1,901 | 61.0 | +10.1 | |
| UKIP | Keith Wells | 594 | 19.1 | +8.8 | |
| Conservative | Dianne Presha | 451 | 14.5 | -10.5 | |
| Liberal Democrats | Rob Bell | 170 | 5.5 | -1.6 | |
| Majority | 1,307 | 41.9 | -9.7 | ||
| Turnout | 3,116 | 27.6 | -5.2 | ||
| Labour hold | Swing | ||||
Wakefield Rural ward
| Party | Candidate | Votes | % | ± | |
|---|---|---|---|---|---|
| Labour | Lawrence Kirkpatrick | 2,003 | 43.5 | +0.9 | |
| Conservative | Tom Fletcher | 1,778 | 38.6 | -5.4 | |
| Green | Miriam Hawkins | 472 | 10.2 | +2.5 | |
| Liberal Democrats | Dennis Cronin | 354 | 7.7 | +2.7 | |
| Majority | 225 | 4.9 | +6.3 | ||
| Turnout | 4,607 | 34 | -6.3 | ||
| Labour gain from Conservative | Swing | ||||
Wakefield South ward
| Party | Candidate | Votes | % | ± | |
|---|---|---|---|---|---|
| Conservative | David Hopkins | 1,851 | 47.8 | -6.9 | |
| Labour | Javed Iqbal | 1,562 | 40.3 | +5.7 | |
| Liberal Democrats | Stephen Nuthall | 462 | 11.9 | +1.8 | |
| Majority | 289 | 7.5 | -12.6 | ||
| Turnout | 3,875 | 36.1 | -7.3 | ||
| Conservative hold | Swing | ||||
Wakefield West ward
| Party | Candidate | Votes | % | ± | |
|---|---|---|---|---|---|
| Labour | Hilary Mitchell | 1,456 | 43.1 | +4.2 | |
| Conservative | Philip Booth | 1,101 | 32.6 | -7.5 | |
| English Democrat | Norman Tate | 594 | 17.6 | +17.6 | |
| Green | Brian Else | 226 | 6.7 | +1.4 | |
| Majority | 355 | 10.5 | |||
| Turnout | 3,377 | 29.5 | -5 | ||
| Labour gain from Conservative | Swing | ||||
Wrenthorpe and Outwood West ward
| Party | Candidate | Votes | % | ± | |
|---|---|---|---|---|---|
| Labour | Martyn Johnson | 1,743 | 46.9 | +2.3 | |
| Conservative | Anne-Marie Glover | 1,037 | 27.9 | -7.9 | |
| UKIP | David Dews | 940 | 25.3 | +11.9 | |
| Majority | 706 | 19 | +10.4 | ||
| Turnout | 3,720 | 31.8 | -7.6 | ||
| Labour gain from Conservative | Swing | ||||
gollark: Or metaapioforms.
gollark: > bee bees<@309787486278909952> Apioapioforms.
gollark: * apiopyroforms
gollark: !
gollark: !
References
- "www.wakefield.gov.uk: Local election results 2010". Archived from the original on 9 May 2011. Retrieved 23 April 2012.
- "www.wakefield.gov.uk: District Council Election Results 2011". Archived from the original on 2 April 2012. Retrieved 23 April 2012.
- "Page Not Found". Archived from the original on 27 September 2012. Retrieved 4 May 2012.
| Bradford | |
|---|---|
| Calderdale | |
| Kirklees | |
| Leeds |
|
| Wakefield | |
| West Yorkshire CC | |
| West Riding CC | |
| |
This article is issued from Wikipedia. The text is licensed under Creative Commons - Attribution - Sharealike. Additional terms may apply for the media files.