1972 United States presidential election in Maryland
The United States presidential election in Maryland, 1972 was held on November 7, 1972. Both the Democratic and Republican (Sargent Shriver and Spiro Agnew, respectively) Vice Presidential nominees were from Maryland.
| ||||||||||||||||||||||||||
All 10 Maryland electoral votes to the Electoral College | ||||||||||||||||||||||||||
|---|---|---|---|---|---|---|---|---|---|---|---|---|---|---|---|---|---|---|---|---|---|---|---|---|---|---|
| ||||||||||||||||||||||||||
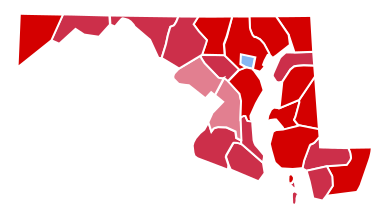 County Results
| ||||||||||||||||||||||||||
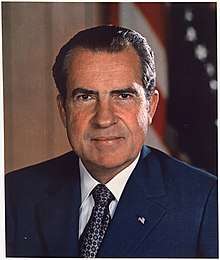
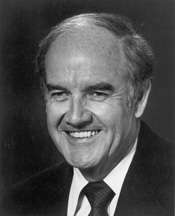
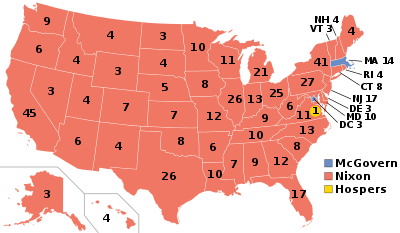
Incumbent President Richard Nixon of California and Vice President Agnew of Maryland won the state, winning 61.26% of the vote to George McGovern and Shriver's 37.36%. Nixon won every county-equivalent in the state except Baltimore City. He won over 77% of the vote in Carroll County, and over 70% in 9 counties overall. This is the last time Prince George's County has voted Republican in a presidential election,[1] and the last of only 6 occasions[lower-alpha 1] since the emergence of the Republican Party that Maryland has voted more Republican than the nation as a whole.[2]
Of his three presidential campaigns, this is the only time in which Nixon carried the home state of his running mate. Nixon failed to carry Maryland in 1968 and in 1960 did not carry Massachusetts the home state of his then running mate Henry Cabot Lodge Jr.
| Elections in Maryland | ||||||||
|---|---|---|---|---|---|---|---|---|
.svg.png) | ||||||||
|
||||||||
|
||||||||
|
Elections by year |
||||||||
|
| ||||||||
Results
| United States presidential election in Maryland, 1972[3] | ||||||
|---|---|---|---|---|---|---|
| Party | Candidate | Running mate | Votes | Percentage | Electoral votes | |
| Republican | Richard Nixon | Spiro Agnew | 829,305 | 61.26% | 10 | |
| Democratic | George McGovern | Sargent Shriver | 505,781 | 37.36% | 0 | |
| American Independent | John G. Schmitz | Thomas J. Anderson | 18,726 | 1.38% | 0 | |
Results by county
| County | Richard Milhous Nixon Republican |
George Stanley McGovern Democratic |
John George Schmitz American Independent |
Margin | Total votes cast[4] | ||||
|---|---|---|---|---|---|---|---|---|---|
| # | % | # | % | # | % | # | % | ||
| Allegany | 20,687 | 64.55% | 10,808 | 33.72% | 553 | 1.73% | 9,879 | 30.83% | 32,048 |
| Anne Arundel | 71,707 | 72.26% | 26,082 | 26.28% | 1,450 | 1.46% | 45,625 | 45.97% | 99,239 |
| Baltimore County | 175,897 | 70.30% | 70,309 | 28.10% | 4,018 | 1.61% | 105,588 | 42.20% | 250,224 |
| Baltimore City | 119,486 | 45.15% | 141,323 | 53.40% | 3,843 | 1.45% | -21,837 | -8.25% | 264,652 |
| Calvert | 4,024 | 63.43% | 2,232 | 35.18% | 88 | 1.39% | 1,792 | 28.25% | 6,344 |
| Caroline | 4,325 | 72.71% | 1,567 | 26.34% | 56 | 0.94% | 2,758 | 46.37% | 5,948 |
| Carroll | 16,847 | 77.25% | 4,408 | 20.21% | 553 | 2.54% | 12,439 | 57.04% | 21,808 |
| Cecil | 10,759 | 70.82% | 4,113 | 27.08% | 319 | 2.10% | 6,646 | 43.75% | 15,191 |
| Charles | 9,665 | 67.34% | 4,502 | 31.37% | 186 | 1.30% | 5,163 | 35.97% | 14,353 |
| Dorchester | 6,859 | 74.97% | 2,136 | 23.35% | 154 | 1.68% | 4,723 | 51.62% | 9,149 |
| Frederick | 19,907 | 69.48% | 8,235 | 28.74% | 509 | 1.78% | 11,672 | 40.74% | 28,651 |
| Garrett | 5,480 | 76.60% | 1,510 | 21.11% | 164 | 2.29% | 3,970 | 55.49% | 7,154 |
| Harford | 25,141 | 73.16% | 8,737 | 25.42% | 488 | 1.42% | 16,404 | 47.73% | 34,366 |
| Howard | 19,265 | 63.55% | 10,668 | 35.19% | 383 | 1.26% | 8,597 | 28.36% | 30,316 |
| Kent | 4,036 | 64.36% | 2,168 | 34.57% | 67 | 1.07% | 1,868 | 29.79% | 6,271 |
| Montgomery | 133,090 | 56.50% | 100,228 | 42.55% | 2,239 | 0.95% | 32,862 | 13.95% | 235,557 |
| Prince George's | 116,166 | 58.55% | 79,914 | 40.28% | 2,330 | 1.17% | 36,252 | 18.27% | 198,410 |
| Queen Anne's | 4,380 | 70.45% | 1,712 | 27.54% | 125 | 2.01% | 2,668 | 42.91% | 6,217 |
| Somerset | 4,342 | 67.33% | 2,036 | 31.57% | 71 | 1.10% | 2,306 | 35.76% | 6,449 |
| St. Mary's | 7,689 | 67.55% | 3,571 | 31.37% | 122 | 1.07% | 4,118 | 36.18% | 11,382 |
| Talbot | 6,620 | 74.73% | 2,181 | 24.62% | 58 | 0.65% | 4,439 | 50.11% | 8,859 |
| Washington | 24,234 | 69.27% | 10,039 | 28.70% | 712 | 2.04% | 14,195 | 40.57% | 34,985 |
| Wicomico | 13,115 | 69.71% | 5,510 | 29.29% | 190 | 1.01% | 7,605 | 40.42% | 18,815 |
| Worcester | 5,584 | 75.22% | 1,792 | 24.14% | 48 | 0.65% | 3,792 | 51.08% | 7,424 |
| Totals | 829,305 | 61.26% | 505,781 | 37.36% | 18,726 | 1.38% | 323,524 | 23.90% | 1,353,812 |
References
- Sullivan, Robert David; ‘How the Red and Blue Map Evolved Over the Past Century’; America Magazine in The National Catholic Review; June 29, 2016
- Counting the Votes; Maryland
- Maryland Manual 1969–1970. The Hall of Records Commission of the State of Maryland. p. 473. Retrieved May 12, 2019.
- Maryland State Board of Elections, ‘For President of the United States’ Maryland General Election Returns – November 7, 1972 (Annapolis, 1972)
Notes
- The other five are 1896 under William Jennings Bryan's "cross of gold" opposed by Northeastern industrialists, and the four elections from 1944 to 1956