Mason County, Kentucky
Mason County is a county located in the U.S. state of Kentucky. As of the 2010 census, the population was 17,490.[1] Its county seat is Maysville.[2] The county was created from Bourbon County, Virginia in 1788 and named for George Mason, a Virginia delegate to the U.S. Constitutional Convention, known as the "Father of the Bill of Rights".[3][4] Mason County comprises the Maysville, KY Micropolitan Statistical Area, which is included in the Cincinnati-Wilmington-Maysville, OH-KY-IN Combined Statistical Area.
Mason County | |
|---|---|
 The Mason County courthouse in Maysville | |
 Location within the U.S. state of Kentucky | |
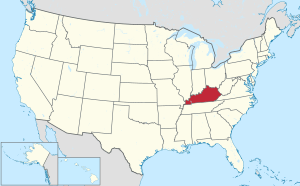 Kentucky's location within the U.S. | |
| Coordinates: 38°36′N 83°50′W | |
| Country | |
| State | |
| Founded | 1788 |
| Named for | George Mason |
| Seat | Maysville |
| Largest city | Maysville |
| Area | |
| • Total | 246 sq mi (640 km2) |
| • Land | 240 sq mi (600 km2) |
| • Water | 6.3 sq mi (16 km2) 2.6%% |
| Population | |
| • Estimate (2018) | 17,150 |
| • Density | 73/sq mi (28/km2) |
| Time zone | UTC−5 (Eastern) |
| • Summer (DST) | UTC−4 (EDT) |
| Congressional district | 4th |
| Website | masoncountykentucky |
Geography
According to the U.S. Census Bureau, the county has a total area of 246 square miles (640 km2), of which 240 square miles (620 km2) is land and 6.3 square miles (16 km2) (2.6%) is water.[5] The county's northern border with Ohio is formed by the Ohio River.
Adjacent counties
- Brown County, Ohio (north)
- Adams County, Ohio (northeast)
- Lewis County (east)
- Fleming County (south)
- Robertson County (southwest)
- Bracken County (west)
Demographics
| Historical population | |||
|---|---|---|---|
| Census | Pop. | %± | |
| 1790 | 2,729 | — | |
| 1800 | 12,182 | 346.4% | |
| 1810 | 12,459 | 2.3% | |
| 1820 | 13,588 | 9.1% | |
| 1830 | 16,199 | 19.2% | |
| 1840 | 15,719 | −3.0% | |
| 1850 | 18,344 | 16.7% | |
| 1860 | 18,222 | −0.7% | |
| 1870 | 18,126 | −0.5% | |
| 1880 | 20,469 | 12.9% | |
| 1890 | 20,773 | 1.5% | |
| 1900 | 20,446 | −1.6% | |
| 1910 | 18,611 | −9.0% | |
| 1920 | 17,760 | −4.6% | |
| 1930 | 18,862 | 6.2% | |
| 1940 | 19,066 | 1.1% | |
| 1950 | 18,486 | −3.0% | |
| 1960 | 18,454 | −0.2% | |
| 1970 | 17,273 | −6.4% | |
| 1980 | 17,765 | 2.8% | |
| 1990 | 16,666 | −6.2% | |
| 2000 | 16,800 | 0.8% | |
| 2010 | 17,490 | 4.1% | |
| Est. 2018 | 17,150 | [6] | −1.9% |
| U.S. Decennial Census[7] 1790-1960[8] 1900-1990[9] 1990-2000[10] 2010-2013[1] | |||
As of the census[11] of 2000, there were 16,800 people, 6,847 households, and 4,697 families residing in the county. The population density was 70 per square mile (27/km2). There were 7,754 housing units at an average density of 32 per square mile (12/km2). The racial makeup of the county was 90.88% White, 7.16% Black or African American, 0.15% Native American, 0.37% Asian, 0.02% Pacific Islander, 0.57% from other races, and 0.85% from two or more races. 0.95% of the population were Hispanic or Latino of any race.
There were 6,847 households out of which 31.30% had children under the age of 18 living with them, 54.20% were married couples living together, 11.10% had a female householder with no husband present, and 31.40% were non-families. 27.60% of all households were made up of individuals and 12.80% had someone living alone who was 65 years of age or older. The average household size was 2.41 and the average family size was 2.92.
In the county, the population was spread out with 24.10% under the age of 18, 8.00% from 18 to 24, 28.50% from 25 to 44, 23.90% from 45 to 64, and 15.50% who were 65 years of age or older. The median age was 38 years. For every 100 females, there were 93.70 males. For every 100 females age 18 and over, there were 89.50 males.
The median income for a household in the county was $30,195, and the median income for a family was $37,257. Males had a median income of $30,718 versus $21,216 for females. The per capita income for the county was $16,589. About 12.90% of families and 16.80% of the population were below the poverty line, including 23.60% of those under age 18 and 13.70% of those age 65 or over.
Communities
Cities
Census-designated place
Politics
Mason County was at the time of the Civil War the easternmost of the strongly secessionist Bluegrass bloc.[12] Mason was in fact the most easterly Kentucky county to be represented at the Russellville Convention of 1861 to discuss the secession of Kentucky from the Union.
Mason County's secessionist sentiment meant that it voted Democratic consistently up until the 1950s, with the exception of the 1928 election when strong local anti-Catholic sentiment against Al Smith allowed Herbert Hoover to carry the county. Since the 1950s, the state has turned Republican due to the increasingly liberal position of the Democratic Party on social issues.
| Year | Republican | Democratic | Third parties |
|---|---|---|---|
| 2016 | 68.5% 4,944 | 27.3% 1,970 | 4.2% 305 |
| 2012 | 61.0% 4,197 | 37.7% 2,592 | 1.3% 92 |
| 2008 | 57.6% 4,102 | 40.6% 2,891 | 1.8% 128 |
| 2004 | 61.9% 4,381 | 37.4% 2,644 | 0.8% 54 |
| 2000 | 60.8% 3,572 | 37.1% 2,178 | 2.1% 123 |
| 1996 | 46.7% 2,588 | 44.1% 2,444 | 9.2% 507 |
| 1992 | 40.3% 2,432 | 44.1% 2,657 | 15.6% 940 |
| 1988 | 53.6% 3,158 | 46.2% 2,721 | 0.3% 16 |
| 1984 | 58.2% 3,751 | 41.3% 2,663 | 0.5% 32 |
| 1980 | 46.5% 2,926 | 50.6% 3,181 | 2.9% 180 |
| 1976 | 42.1% 2,529 | 56.6% 3,397 | 1.3% 78 |
| 1972 | 58.5% 3,529 | 40.7% 2,459 | 0.8% 49 |
| 1968 | 40.5% 2,661 | 42.2% 2,772 | 17.3% 1,137 |
| 1964 | 35.1% 2,437 | 64.8% 4,502 | 0.2% 13 |
| 1960 | 57.9% 4,334 | 42.1% 3,153 | |
| 1956 | 51.8% 3,880 | 47.7% 3,572 | 0.5% 38 |
| 1952 | 49.9% 3,606 | 50.0% 3,614 | 0.1% 8 |
| 1948 | 40.1% 2,519 | 57.7% 3,620 | 2.2% 138 |
| 1944 | 45.8% 3,256 | 53.6% 3,810 | 0.6% 39 |
| 1940 | 45.6% 3,704 | 54.0% 4,386 | 0.3% 27 |
| 1936 | 41.6% 3,317 | 56.5% 4,503 | 1.9% 147 |
| 1932 | 38.6% 3,213 | 60.8% 5,065 | 0.7% 56 |
| 1928 | 59.8% 5,012 | 40.1% 3,364 | 0.1% 6 |
| 1924 | 48.3% 3,406 | 50.0% 3,525 | 1.8% 124 |
| 1920 | 44.2% 3,743 | 55.3% 4,691 | 0.5% 42 |
| 1916 | 42.5% 2,127 | 56.4% 2,820 | 1.1% 53 |
| 1912 | 33.8% 1,558 | 53.8% 2,475 | 12.4% 572 |
Education
Mason County Schools operates public schools.
Schools:
- Mason County High School
- Mason County Middle School
- Mason County Intermediate School
- Straub Elementary School
In 1990 the Maysville Independent School District merged into the Mason County school district.[14]
Notable residents
- Joshua Bean, first Mayor of San Diego (1850-1851).
- Albert Sidney Johnston, Commander of the Army of the Republic of Texas, Secretary of War for Texas, Commander of the Western Department for the Confederacy. Died at the Battle of Shiloh.
- Judge Roy Bean, Famous Hanging judge of Texas. (Law West of the Pecos)
- Deron Feldhaus, member of "The Unforgettables"
- Chris Lofton, Played basketball for the University of Tennessee. 2003 Ky. "Mr. Basketball'
- Darius Miller, Played for University of Kentucky Basketball. 2012 NCCA Champion, 2008 Ky. "Mr. Basketball" and plays basketball for the New Orleans Pelicans.
References
- "State & County QuickFacts". United States Census Bureau. Archived from the original on June 7, 2011. Retrieved March 6, 2014.
- "Find a County". National Association of Counties. Retrieved 2011-06-07.
- "Mason County". The Kentucky Encyclopedia. 2000. Retrieved August 23, 2014.
- Collins, Lewis (1882). Collins' Historical Sketches of Kentucky: History of Kentucky, Volume 2. Collins & Company. p. 26.
- "2010 Census Gazetteer Files". United States Census Bureau. August 22, 2012. Archived from the original on August 12, 2014. Retrieved August 17, 2014.
- "Population and Housing Unit Estimates". Retrieved July 29, 2019.
- "U.S. Decennial Census". United States Census Bureau. Retrieved August 17, 2014.
- "Historical Census Browser". University of Virginia Library. Retrieved August 17, 2014.
- "Population of Counties by Decennial Census: 1900 to 1990". United States Census Bureau. Retrieved August 17, 2014.
- "Census 2000 PHC-T-4. Ranking Tables for Counties: 1990 and 2000" (PDF). United States Census Bureau. Retrieved August 17, 2014.
- "U.S. Census website". United States Census Bureau. Retrieved 2008-01-31.
- Copeland, James E.; 'Where Were the Kentucky Unionists and Secessionists'; The Register of the Kentucky Historical Society, volume 71, no. 4 (October, 1973), pp. 344-363
- Leip, David. "Dave Leip's Atlas of U.S. Presidential Elections". uselectionatlas.org. Retrieved 2018-07-04.
- Ellis, Ronnie (2007-01-15). "The ups and downs of merging school districts". Richmond Register. Retrieved 2018-05-21.
External links
- Mason County government's website
- Historical Texts and Images of Mason County
- Mason County school district's website
Municipalities and communities of Mason County, Kentucky, United States | ||
|---|---|---|
| Cities | Location of Mason County, Kentucky | |
| CDP | ||
| Other unincorporated communities | ||
| Footnotes | ‡This populated place also has portions in an adjacent county or counties | |
| Authority control |
|
|---|