Marion County, Kentucky
Marion County is a county in the U.S. state of Kentucky. As of the 2010 census, the population was 19,820.[1] Its county seat is Lebanon.[2] The county was founded in 1834 and named for Francis Marion, the American Revolutionary War hero known as the "Swamp Fox".[3][4][5]
Marion County | |
|---|---|
 Marion County courthouse in Lebanon | |
 Location within the U.S. state of Kentucky | |
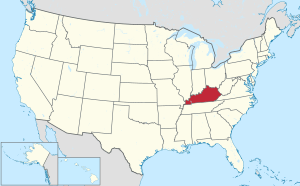 Kentucky's location within the U.S. | |
| Coordinates: 37°33′N 85°16′W | |
| Country | |
| State | |
| Founded | 1834 |
| Named for | Francis Marion |
| Seat | Lebanon |
| Largest city | Lebanon |
| Area | |
| • Total | 347 sq mi (900 km2) |
| • Land | 343 sq mi (890 km2) |
| • Water | 3.9 sq mi (10 km2) 1.1%% |
| Population | |
| • Estimate (2018) | 19,404 |
| • Density | 58/sq mi (22/km2) |
| Time zone | UTC−5 (Eastern) |
| • Summer (DST) | UTC−4 (EDT) |
| Congressional district | 1st |
| Website | www |
Geography
According to the U.S. Census Bureau, the county has a total area of 347 square miles (900 km2), of which 343 square miles (890 km2) is land and 3.9 square miles (10 km2) (1.1%) is water.[6]
Marion County includes the geographic center of the state of Kentucky, which is located 3 miles NNW of Lebanon, just off KY 429. Marion County was formed in 1834 from part of Washington County.[7] Marion County is Kentucky's most Catholic county. The first Catholic settlers in Kentucky came to Holy Cross in the western part of the county circa 1790.
Adjacent counties
- Washington County (north)
- Boyle County (northeast)
- Casey County (southeast)
- Taylor County (south)
- LaRue County (southwest)
- Nelson County (northwest)
Demographics
| Historical population | |||
|---|---|---|---|
| Census | Pop. | %± | |
| 1840 | 11,032 | — | |
| 1850 | 11,765 | 6.6% | |
| 1860 | 12,593 | 7.0% | |
| 1870 | 12,838 | 1.9% | |
| 1880 | 14,693 | 14.4% | |
| 1890 | 15,648 | 6.5% | |
| 1900 | 16,290 | 4.1% | |
| 1910 | 16,330 | 0.2% | |
| 1920 | 15,527 | −4.9% | |
| 1930 | 15,499 | −0.2% | |
| 1940 | 16,913 | 9.1% | |
| 1950 | 17,212 | 1.8% | |
| 1960 | 16,887 | −1.9% | |
| 1970 | 16,714 | −1.0% | |
| 1980 | 17,910 | 7.2% | |
| 1990 | 16,499 | −7.9% | |
| 2000 | 18,212 | 10.4% | |
| 2010 | 19,820 | 8.8% | |
| Est. 2018 | 19,404 | [8] | −2.1% |
| U.S. Decennial Census[9] 1790-1960[10] 1900-1990[11] 1990-2000[12] 2010-2013[1] | |||
As of the census[13] of 2000, there were 18,212 people, 6,613 households, and 4,754 families residing in the county. The population density was 53 per square mile (20/km2). There were 7,277 housing units at an average density of 21 per square mile (8.1/km2). The racial makeup of the county was 89.17% White, 9.12% Black or African American, 0.09% Native American, 0.43% Asian, 0.01% Pacific Islander, 0.35% from other races, and 0.82% from two or more races. 0.79% of the population were Hispanic or Latino of any race.
There were 6,613 households out of which 35.60% had children under the age of 18 living with them, 53.80% were married couples living together, 13.70% had a female householder with no husband present, and 28.10% were non-families. 24.40% of all households were made up of individuals and 10.10% had someone living alone who was 65 years of age or older. The average household size was 2.58 and the average family size was 3.06.
By age, 25.20% of the population was under 18, 9.90% from 18 to 24, 30.30% from 25 to 44, 21.70% from 45 to 64, and 12.80%were 65 years or older. The median age was 35 years. For every 100 females there were 102.30 males. For every 100 females age 18 and over, there were 101.60 males.
The median income for a household in the county was $30,387, and the median income for a family was $35,648. Males had a median income of $27,826 versus $20,699 for females. The per capita income for the county was $14,472. About 15.80% of families and 18.60% of the population were below the poverty line, including 21.80% of those under age 18 and 17.90% of those age 65 or over.
Communities
- Bradfordsville
- Gravel Switch
- Lebanon (county seat)
- Loretto
- Nerinx
- Raywick
Politics
| Year | Republican | Democratic | Third parties |
|---|---|---|---|
| 2016 | 63.2% 5,122 | 33.0% 2,679 | 3.8% 310 |
| 2012 | 51.9% 3,800 | 46.7% 3,418 | 1.4% 100 |
| 2008 | 50.5% 3,842 | 47.2% 3,596 | 2.3% 177 |
| 2004 | 53.1% 3,905 | 46.2% 3,399 | 0.7% 50 |
| 2000 | 52.8% 3,259 | 45.0% 2,778 | 2.3% 139 |
| 1996 | 35.3% 2,013 | 51.2% 2,922 | 13.6% 775 |
| 1992 | 33.1% 2,091 | 53.8% 3,403 | 13.1% 830 |
| 1988 | 44.1% 2,500 | 55.6% 3,152 | 0.4% 21 |
| 1984 | 53.7% 3,305 | 46.0% 2,835 | 0.3% 19 |
| 1980 | 36.6% 2,126 | 61.5% 3,577 | 2.0% 113 |
| 1976 | 32.4% 1,723 | 66.1% 3,520 | 1.5% 79 |
| 1972 | 49.7% 2,370 | 49.3% 2,351 | 0.9% 44 |
| 1968 | 33.0% 1,620 | 49.7% 2,436 | 17.3% 850 |
| 1964 | 20.1% 1,074 | 79.8% 4,265 | 0.1% 5 |
| 1960 | 33.9% 2,203 | 66.1% 4,292 | 0.0% 0 |
| 1956 | 50.0% 2,945 | 49.7% 2,927 | 0.3% 20 |
| 1952 | 41.7% 2,262 | 58.2% 3,159 | 0.2% 8 |
| 1948 | 27.4% 1,171 | 70.4% 3,008 | 2.2% 92 |
| 1944 | 35.6% 1,673 | 63.8% 2,996 | 0.5% 25 |
| 1940 | 33.5% 1,763 | 66.2% 3,482 | 0.4% 19 |
| 1936 | 30.5% 1,567 | 68.5% 3,526 | 1.0% 53 |
| 1932 | 26.1% 1,571 | 73.5% 4,427 | 0.4% 23 |
| 1928 | 40.9% 2,395 | 59.0% 3,461 | 0.1% 7 |
| 1924 | 38.5% 1,975 | 59.6% 3,055 | 1.9% 96 |
| 1920 | 38.9% 2,431 | 60.8% 3,807 | 0.3% 20 |
| 1916 | 40.2% 1,396 | 59.3% 2,063 | 0.5% 18 |
| 1912 | 22.0% 735 | 55.3% 1,848 | 22.7% 759 |
References
- "State & County QuickFacts". United States Census Bureau. Archived from the original on June 7, 2011. Retrieved March 6, 2014.
- "Find a County". National Association of Counties. Retrieved 2011-06-07.
- E., Kleber, John; Kentucky, University Press of; Policy, Institute for Regional Analysis and Public; Library, Camden-Carroll; University, Morehead State (2000). "The Kentucky Encyclopedia". www.kyenc.org. Retrieved 2018-07-04.
- The Register of the Kentucky State Historical Society, Volume 1. Kentucky State Historical Society. 1903. pp. 36.
- Collins, Lewis (1877). History of Kentucky. p. 538.
- "2010 Census Gazetteer Files". United States Census Bureau. August 22, 2012. Archived from the original on August 12, 2014. Retrieved August 17, 2014.
- Kentucky County Formation Chart, Kentucky Department for Libraries and Archives, accessed June 2018.
- "Population and Housing Unit Estimates". Retrieved July 29, 2019.
- "U.S. Decennial Census". United States Census Bureau. Retrieved August 17, 2014.
- "Historical Census Browser". University of Virginia Library. Retrieved August 17, 2014.
- "Population of Counties by Decennial Census: 1900 to 1990". United States Census Bureau. Retrieved August 17, 2014.
- "Census 2000 PHC-T-4. Ranking Tables for Counties: 1990 and 2000" (PDF). United States Census Bureau. Retrieved August 17, 2014.
- "U.S. Census website". United States Census Bureau. Retrieved 2008-01-31.
- Leip, David. "Dave Leip's Atlas of U.S. Presidential Elections". uselectionatlas.org. Retrieved 2018-07-04.
Municipalities and communities of Marion County, Kentucky, United States | ||
|---|---|---|
| Cities | Location of Marion County, Kentucky | |
| Unincorporated communities | ||

| Authority control |
|
|---|