Weishan Yi and Hui Autonomous County
Weishan Yi and Hui Autonomous County (Chinese: 巍山彝族回族自治县; pinyin: Wēishān Yízú Huízú Zìzhìxiàn; Xiao'erjing: وِشًا یِذُو خُوِذُو ذِجِشِیًا) is an autonomous county in the Dali Bai Autonomous Prefecture, in the west-central part of Yunnan Province, China. It was known as Menghua (蒙化) until the 1950s.
Weishan County 巍山县 · وِشًا | |
|---|---|
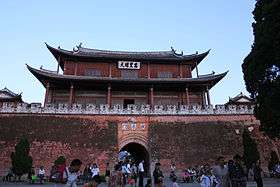 Gongchen Tower, atop the Gongchen Gate, is a symbol of Weishan | |
.png) Location of Weishan County (pink) in Dali Prefecture (yellow) and Yunnan | |
| Coordinates (Weishan County government): 25°13′37″N 100°18′25″E | |
| Country | People's Republic of China |
| Province | Yunnan |
| Autonomous prefecture | Dali |
| Area | |
| • Total | 2,200 km2 (800 sq mi) |
| Population (2010) | |
| • Total | 304,400 |
| • Density | 140/km2 (360/sq mi) |
| Time zone | UTC+8 (CST) |
| Postal code | 672400 |
| Area code(s) | 0872 |
| Climate | Cwb |
| Website | www |
Geography
It is situated in the upper section of the Ailao Mountains and the Wuliang Mountains.
Climate
| Climate data for Weishan (1981−2010) | |||||||||||||
|---|---|---|---|---|---|---|---|---|---|---|---|---|---|
| Month | Jan | Feb | Mar | Apr | May | Jun | Jul | Aug | Sep | Oct | Nov | Dec | Year |
| Record high °C (°F) | 23.6 (74.5) |
25.6 (78.1) |
29.6 (85.3) |
31.5 (88.7) |
34.3 (93.7) |
32.5 (90.5) |
31.9 (89.4) |
31.2 (88.2) |
31.0 (87.8) |
28.8 (83.8) |
25.4 (77.7) |
22.6 (72.7) |
34.3 (93.7) |
| Average high °C (°F) | 17.4 (63.3) |
18.9 (66.0) |
22.2 (72.0) |
25.0 (77.0) |
26.6 (79.9) |
26.5 (79.7) |
25.8 (78.4) |
26.2 (79.2) |
25.2 (77.4) |
23.4 (74.1) |
20.2 (68.4) |
17.7 (63.9) |
22.9 (73.3) |
| Daily mean °C (°F) | 8.5 (47.3) |
10.3 (50.5) |
13.5 (56.3) |
16.9 (62.4) |
20.1 (68.2) |
21.7 (71.1) |
21.2 (70.2) |
20.8 (69.4) |
19.4 (66.9) |
17.0 (62.6) |
12.4 (54.3) |
8.9 (48.0) |
15.9 (60.6) |
| Average low °C (°F) | 1.5 (34.7) |
3.1 (37.6) |
6.1 (43.0) |
10.1 (50.2) |
14.7 (58.5) |
18.2 (64.8) |
18.3 (64.9) |
17.5 (63.5) |
16.0 (60.8) |
13.1 (55.6) |
7.2 (45.0) |
2.8 (37.0) |
10.7 (51.3) |
| Record low °C (°F) | −4.0 (24.8) |
−2.4 (27.7) |
−0.9 (30.4) |
2.5 (36.5) |
7.7 (45.9) |
12.3 (54.1) |
12.9 (55.2) |
11.6 (52.9) |
6.8 (44.2) |
5.0 (41.0) |
0.6 (33.1) |
−4.5 (23.9) |
−4.5 (23.9) |
| Average precipitation mm (inches) | 17.8 (0.70) |
21.7 (0.85) |
24.9 (0.98) |
27.6 (1.09) |
64.5 (2.54) |
119.2 (4.69) |
157.3 (6.19) |
145.9 (5.74) |
109.6 (4.31) |
86.2 (3.39) |
31.1 (1.22) |
9.8 (0.39) |
815.6 (32.09) |
| Average relative humidity (%) | 67 | 62 | 59 | 59 | 63 | 73 | 80 | 83 | 82 | 79 | 76 | 73 | 71 |
| Source: China Meteorological Data Service Center | |||||||||||||
gollark: ... obviously, I have to go there to sign stuff sometimes.
gollark: Oh, that's where the potatOS master signing key is stored.
gollark: But you could accidentally write the proof wrong.
gollark: Yes. That is what I said.
gollark: It can't stop you from writing an entirely valid and well-typed program which releases bees into the internet when you *meant* to write a fibonacci program.
External links
| Authority control |
|
|---|
This article is issued from Wikipedia. The text is licensed under Creative Commons - Attribution - Sharealike. Additional terms may apply for the media files.