Harper County, Oklahoma
Harper County is a county located in the U.S. state of Oklahoma. As of the 2010 census, the population was 3,685,[1] making it the fourth-least populous county in Oklahoma. The county seat is Buffalo.[2] It was created in 1907 from the northwestern part of Woodward County, and named for Oscar Green Harper, who was clerk of the Oklahoma Constitutional Convention.[3]
Harper County | |
|---|---|
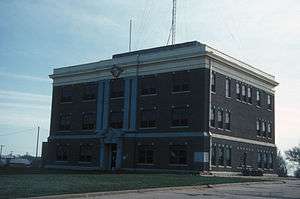
 Harper County Courthouse in Buffalo (2007) | |
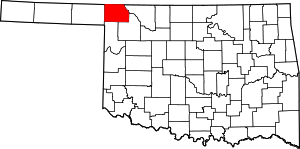
 Location within the U.S. state of Oklahoma | |
 Oklahoma's location within the U.S. | |
| Coordinates: 36°47′N 99°39′W | |
| Country | |
| State | |
| Founded | 1907 |
| Seat | Buffalo |
| Largest town | Laverne |
| Area | |
| • Total | 1,041 sq mi (2,700 km2) |
| • Land | 1,039 sq mi (2,690 km2) |
| • Water | 2.0 sq mi (5 km2) 0.2%% |
| Population | |
| • Estimate (2018) | 3,797 |
| • Density | 3.5/sq mi (1.4/km2) |
| Time zone | UTC−6 (Central) |
| • Summer (DST) | UTC−5 (CDT) |
| Congressional district | 3rd |
History
During the late 19th century, the area now known as Harper County was part of the Cherokee Outlet, reserved for use by the Cherokee Nation by treaties in 1828 and 1835, The U.S. government opened the outlet for settlement by non-Indians in 1893. The area was divided into counties after the formation of what is now the state of Oklahoma. Harper County was created in 1907. It was named for Oscar Green Harper, who was a local resident, school teacher, and served as clerk of the Oklahoma Constitutional Convention.[3]
The present county lay on several trails that were blazed during the 19th century. One of the most significant was the Fort Dodge to Camp Supply Military Trail. It was used followed in 1868 by the U.S. Army's Seventh Cavalry, to move men and supplies to build Camp Supply (forerunner of the present town of Fort Supply, Oklahoma). The Great Western Trail (also known as the Dodge City Trail) was first used between South Texas and Fort Robinson, Nebraska, in 1874. The Cimarron Valley Turnpike Company built a bridge over the Cimarron River in 1908 to facilitate travel between Englewood, Kansas and Oklahoma.[3]
A 1908 election was held to determine whether Buffalo or Doby Springs would become the county seat. Buffalo won the election. Doby Springs later ceased to be a town and is now a park in Buffalo.[3] Other ghost towns in the county are Paruna, Flat, Avis, Readout, Cross, Alto, Cupid, and Stockholm.[3]
Railroads first came to Harper County in 1912, when the Wichita Falls and Northwestern Railway, a subsidiary of the Missouri, Kansas and Texas Railway (MK&T), built a line through Dunlap, May, Laverne, and Rosston. The locally owned Buffalo and Northwestern Railroad (B&NW), connected Buffalo with Waynoka in 1919–20. The Atchison, Topeka and Santa Fe Railway acquired the B&NW in 1920. The MK&T line was abandoned in 1970.[3]
Geography
According to the U.S. Census Bureau, the county has a total area of 1,041 square miles (2,700 km2), of which 1,039 square miles (2,690 km2) is land and 2.0 square miles (5.2 km2) (0.2%) is water.[4] The county is drained by the Cimarron River and the North Canadian River.[3]
Major highways


Adjacent counties
- Comanche County, Kansas (northeast)
- Woods County (east)
- Woodward County (southeast)
- Ellis County (south)
- Beaver County (west)
- Clark County, Kansas (northwest)
Demographics
| Historical population | |||
|---|---|---|---|
| Census | Pop. | %± | |
| 1910 | 8,189 | — | |
| 1920 | 7,623 | −6.9% | |
| 1930 | 7,761 | 1.8% | |
| 1940 | 6,454 | −16.8% | |
| 1950 | 5,777 | −10.5% | |
| 1960 | 5,956 | 3.1% | |
| 1970 | 5,151 | −13.5% | |
| 1980 | 4,715 | −8.5% | |
| 1990 | 4,063 | −13.8% | |
| 2000 | 3,562 | −12.3% | |
| 2010 | 3,685 | 3.5% | |
| Est. 2018 | 3,797 | [5] | 3.0% |
| U.S. Decennial Census[6] 1790-1960[7] 1900-1990[8] 1990-2000[9] 2010-2013[1] | |||
As of the census[10] of 2000, there were 3,562 people, 1,509 households, and 1,030 families residing in the county. The population density was 3 people per square mile (1/km²). There were 1,863 housing units at an average density of 2 per square mile (1/km²). The racial makeup of the county was 95.87% White, 0.03% Black or African American, 0.93% Native American, 0.08% Asian, 0.03% Pacific Islander, 2.36% from other races, and 0.70% from two or more races. 5.64% of the population were Hispanic or Latino of any race.
There were 1,509 households out of which 28.00% had children under the age of 18 living with them, 58.60% were married couples living together, 6.50% had a female householder with no husband present, and 31.70% were non-families. 29.20% of all households were made up of individuals and 15.60% had someone living alone who was 65 years of age or older. The average household size was 2.33 and the average family size was 2.87.
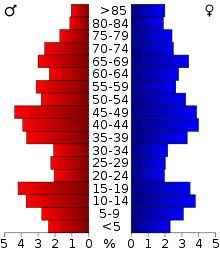
In the county, the population was spread out with 23.30% under the age of 18, 6.40% from 18 to 24, 23.40% from 25 to 44, 25.20% from 45 to 64, and 21.70% who were 65 years of age or older. The median age was 43 years. For every 100 females there were 96.60 males. For every 100 females age 18 and over, there were 95.20 males.
The median income for a household in the county was $33,705, and the median income for a family was $40,907. Males had a median income of $27,896 versus $20,784 for females. The per capita income for the county was $18,011. About 7.10% of families and 10.20% of the population were below the poverty line, including 15.90% of those under age 18 and 4.00% of those age 65 or over.
Politics
| Voter Registration and Party Enrollment as of January 15, 2019[11] | |||||
|---|---|---|---|---|---|
| Party | Number of Voters | Percentage | |||
| Democratic | 441 | 22.65% | |||
| Republican | 1,334 | 68.52% | |||
| Others | 172 | 8.83% | |||
| Total | 1,947 | 100% | |||
| Year | Republican | Democratic | Third parties |
|---|---|---|---|
| 2016 | 87.9% 1,318 | 8.9% 134 | 3.1% 47 |
| 2012 | 87.9% 1,261 | 12.1% 173 | |
| 2008 | 85.9% 1,342 | 14.1% 221 | |
| 2004 | 83.9% 1,397 | 16.1% 268 | |
| 2000 | 77.0% 1,296 | 22.2% 374 | 0.8% 13 |
| 1996 | 58.3% 1,036 | 28.7% 511 | 13.0% 231 |
| 1992 | 51.0% 1,038 | 23.9% 486 | 25.1% 511 |
| 1988 | 67.4% 1,281 | 31.2% 593 | 1.4% 26 |
| 1984 | 81.5% 1,748 | 17.4% 373 | 1.2% 25 |
| 1980 | 74.1% 1,652 | 23.2% 517 | 2.7% 61 |
| 1976 | 56.2% 1,303 | 42.2% 978 | 1.7% 39 |
| 1972 | 79.8% 1,976 | 15.6% 385 | 4.6% 114 |
| 1968 | 63.0% 1,483 | 22.0% 518 | 15.0% 353 |
| 1964 | 52.7% 1,379 | 47.4% 1,240 | |
| 1960 | 73.4% 2,057 | 26.6% 744 | |
| 1956 | 68.4% 1,596 | 31.6% 736 | |
| 1952 | 73.7% 2,057 | 26.4% 736 | |
| 1948 | 48.8% 1,221 | 51.2% 1,281 | |
| 1944 | 56.4% 1,394 | 42.7% 1,056 | 0.9% 23 |
| 1940 | 52.6% 1,616 | 46.2% 1,419 | 1.2% 38 |
| 1936 | 36.7% 1,068 | 63.1% 1,836 | 0.2% 7 |
| 1932 | 26.8% 783 | 73.2% 2,139 | |
| 1928 | 66.5% 1,844 | 31.4% 872 | 2.1% 59 |
| 1924 | 50.8% 1,226 | 34.1% 824 | 15.1% 365 |
| 1920 | 60.0% 1,404 | 32.2% 753 | 7.8% 182 |
| 1916 | 35.1% 662 | 42.3% 798 | 22.6% 427 |
| 1912 | 45.3% 679 | 34.9% 523 | 19.9% 298 |
Communities
References
- "State & County QuickFacts". United States Census Bureau. Archived from the original on June 6, 2011. Retrieved November 9, 2013.
- "Find a County". National Association of Counties. Retrieved 2011-06-07.
- Richter, Sara Jane and Tom Lewis. "Harper County," Encyclopedia of Oklahoma History and Culture, Oklahoma Historical Society, 2009. Accessed April 4, 2015.
- "2010 Census Gazetteer Files". United States Census Bureau. August 22, 2012. Retrieved February 21, 2015.
- "Population and Housing Unit Estimates". Retrieved December 28, 2019.
- "U.S. Decennial Census". United States Census Bureau. Retrieved February 21, 2015.
- "Historical Census Browser". University of Virginia Library. Retrieved February 21, 2015.
- Forstall, Richard L., ed. (March 27, 1995). "Population of Counties by Decennial Census: 1900 to 1990". United States Census Bureau. Retrieved February 21, 2015.
- "Census 2000 PHC-T-4. Ranking Tables for Counties: 1990 and 2000" (PDF). United States Census Bureau. April 2, 2001. Retrieved February 21, 2015.
- "U.S. Census website". United States Census Bureau. Retrieved 2008-01-31.
- "Oklahoma Registration Statistics by County" (PDF). OK.gov. January 15, 2019. Retrieved 2019-02-27.
- Leip, David. "Dave Leip's Atlas of U.S. Presidential Elections". uselectionatlas.org. Retrieved 2018-03-29.

