Connecticut's 2nd congressional district
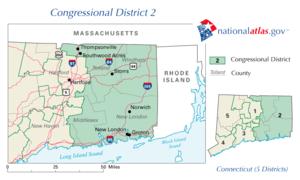
Connecticut's 2nd congressional district is a congressional district in the U.S. state of Connecticut. Located in the eastern part of the state, the district includes all of New London County, Tolland County, and Windham County, along with parts of Hartford, Middlesex, and New Haven counties.
| Connecticut's 2nd congressional district | |||
|---|---|---|---|
.tif.png) Connecticut's 2nd congressional district – since January 3, 2013. | |||
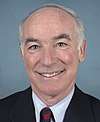
| Representative |
| ||
| Area | 2,143 sq mi (5,550 km2) | ||
| Distribution |
| ||
| Population (2017) | 705,217 | ||
| Median income | $73,805[1] | ||
| Ethnicity |
| ||
| Cook PVI | D+3[2] | ||
Principal cities include: Enfield, Norwich, New London, and Groton.
The district is currently represented by Democrat Joe Courtney.
Towns in the district
Hartford County – Enfield, Glastonbury (part), Marlborough, and Suffield.
Middlesex County – Chester, Clinton, Deep River, East Haddam, East Hampton, Essex, Haddam, Killingworth, Old Saybrook, and Westbrook.
New Haven County – Madison.
New London County – Bozrah, Colchester, East Lyme, Franklin, Griswold, Groton, Lebanon, Ledyard, Lisbon, Lyme, Montville, New London, North Stonington, Norwich, Old Lyme, Preston, Salem, Sprague, Stonington, Voluntown, and Waterford.
Tolland County – Andover, Bolton, Columbia, Coventry, Ellington, Hebron, Mansfield, Somers, Stafford, Tolland, Union, Vernon, and Willington.
Windham County – Ashford, Brooklyn, Canterbury, Chaplin, Eastford, Hampton, Killingly, Plainfield, Pomfret, Putnam, Scotland, Sterling, Thompson, Windham, and Woodstock.
Voter registration
| Voter registration and party enrollment as of October 30, 2012[3] | |||||
|---|---|---|---|---|---|
| Party | Active | Inactive | Total | Percentage | |
| Democratic | 119,995 | 5,501 | 125,496 | 28.94% | |
| Republican | 90,371 | 4,174 | 94,545 | 21.80% | |
| Minor Parties | 580 | 48 | 628 | 0.14% | |
| Unaffiliated | 201,003 | 12,027 | 213,030 | 49.12% | |
| Total | 411,949 | 21,750 | 433,699 | 100% | |
Recent presidential elections
| Election results from presidential races | ||
|---|---|---|
| Year | Office | Results |
| 2000 | President | Gore 55–38% |
| 2004 | President | Kerry 54–44% |
| 2008 | President | Obama 58–40% |
| 2012 | President | Obama 56–43% |
| 2016 | President | Clinton 49–46% |
Recent elections
1992
| Party | Candidate | Votes | % | ± | |
|---|---|---|---|---|---|
| Democratic | Samuel Gejdenson (incumbent) | 123,291 | 51% | ||
| Republican | Edward W. Munster | 119,416 | 49% | ||
| Democratic hold | Swing | ||||
| Turnout | 242,707 | 100% | |||
1994
| Party | Candidate | Votes | % | ± | |
|---|---|---|---|---|---|
| Democratic | Samuel Gejdenson (incumbent) | 79,188 | 43% | ||
| Republican | Edward W. Munster | 79,167 | 43% | ||
| A Connecticut Party | David Bingham | 27,716 | 14% | ||
| Democratic hold | Swing | ||||
| Turnout | 186,071 | 100% | |||
1996
| Party | Candidate | Votes | % | ± | |
|---|---|---|---|---|---|
| Democratic | Samuel Gejdenson (incumbent) | 115,175 | 52% | ||
| Republican | Edward W. Munster | 100,332 | 45% | ||
| Independence Party of America | Dianne G. Ondusko | 6,477 | 3% | ||
| Natural Law | Thomas E. Hall | 1,263 | 0.4% | ||
| Democratic hold | Swing | ||||
| Turnout | 223,258 | 100% | |||
1998
| Party | Candidate | Votes | % | ± | |
|---|---|---|---|---|---|
| Democratic | Samuel Gejdenson (inc.) | 99,567 | 61% | ||
| Republican | Gary M. Koval | 57,860 | 35% | ||
| Independence Party of America | Dianne G. Ondusko | 5,116 | 3% | ||
| Term Limits | Paul W. Cook | 658 | 0.4% | ||
| Democratic hold | Swing | ||||
| Turnout | 163,201 | 100% | |||
2000
| Party | Candidate | Votes | % | ± | |
|---|---|---|---|---|---|
| Republican | Rob Simmons | 114,380 | 51% | ||
| Democratic | Samuel Gejdenson (incumbent) | 111,520 | 49% | ||
| Republican gain from Democratic | Swing | ||||
| Turnout | 225,900 | 100% | |||
2002
| Party | Candidate | Votes | % | ± | |
|---|---|---|---|---|---|
| Republican | Rob Simmons (incumbent) | 117,434 | 54% | ||
| Democratic | Joe Courtney | 99,674 | 46% | ||
| Republican hold | Swing | ||||
| Turnout | 217,108 | 100% | |||
2004
| Party | Candidate | Votes | % | ± | |
|---|---|---|---|---|---|
| Republican | Rob Simmons (inc.) | 165,558 | 54% | ||
| Democratic | James Sullivan | 139,987 | 46% | - | |
| Republican hold | Swing | ||||
| Turnout | 305,545 | 100% | |||
2006
| Party | Candidate | Votes | % | ± | |
|---|---|---|---|---|---|
| Democratic | Joe Courtney | 121,248 | 50% | ||
| Republican | Rob Simmons (incumbent) | 121,158 | 50% | ||
| Democratic gain from Republican | Swing | ||||
| Turnout | 242,413 | 100% | |||
2008
| Party | Candidate | Votes | % | ± | |
|---|---|---|---|---|---|
| Democratic | Joe Courtney (incumbent) | 212,411 | 66% | ||
| Republican | Sean Sullivan | 104,469 | 32% | ||
| Green | G. Scott Deshefy | 6,287 | 2% | ||
| Democratic hold | Swing | ||||
| Turnout | 323,167 | 100% | |||
2010
| Party | Candidate | Votes | % | ± | |
|---|---|---|---|---|---|
| Democratic | Joe Courtney (incumbent) | 147,748 | 60% | ||
| Republican | Janet Peckinpaugh | 95,671 | 39% | ||
| Green | G. Scott Deshefy | 3,344 | 1% | ||
| Democratic hold | Swing | ||||
| Turnout | 246,763 | 100% | |||
2012
| Party | Candidate | Votes | % | ± | |
|---|---|---|---|---|---|
| Democratic | Joe Courtney (incumbent) | 204,691 | 68% | ||
| Republican | Paul Formica | 87,828 | 29% | ||
| Green | Colin Bennett | 3,269 | 2% | ||
| Libertarian | Daniel Reale | 3,504 | 1% | ||
| Democratic hold | Swing | ||||
| Turnout | 299,652 | 100% | |||
2014
| Party | Candidate | Votes | % | ± | |
|---|---|---|---|---|---|
| Democratic | Joe Courtney (incumbent) | 141,948 | 62% | ||
| Republican | Lori Hopkins-Cavanagh | 80,837 | 36% | ||
| Green | William Clyde | 2,602 | 1% | ||
| Libertarian | Daniel Reale | 2,549 | 1% | ||
| Democratic hold | Swing | ||||
| Turnout | 227,936 | 100% | |||
2016
| Party | Candidate | Votes | % | ± | |
|---|---|---|---|---|---|
| Democratic | Joe Courtney (incumbent) | 207,584 | 63% | ||
| Republican | Daria Novak | 111,587 | 34% | ||
| Green | Jonathan Pelto | 5,332 | 2% | ||
| Libertarian | Daniel Reale | 5,016 | 1% | ||
| Democratic hold | Swing | ||||
| Turnout | 329,519 | 100% | |||
2018
| Party | Candidate | Votes | % | ± | |
|---|---|---|---|---|---|
| Democratic | Joe Courtney (incumbent) | 179,731 | 62% | ||
| Republican | Dan Postemski | 102,483 | 35% | ||
| Green | Michelle Louise Bicking | 3,595 | 1% | ||
| Libertarian | Dan Reale | 3,305 | 1% | ||
| Democratic hold | Swing | ||||
| Turnout | 289,114 | 100% | |||
List of members representing the district
District organized from Connecticut's At-large congressional district in 1837.
| Member (Residence)}} |
Party | Years of Service | Cong ress |
Electoral history |
|---|---|---|---|---|
| Samuel Ingham (Essex |
Democratic | March 4, 1837 – March 3, 1839 |
25th | Redistricted from the at-large district and re-elected in 1837. Lost re-election. |
| William L. Storrs (Middletown |
Whig | March 4, 1839 – June, 1840 |
26th | [data unknown/missing] Resigned when appointed Associate Justice of the Connecticut Supreme Court. |
| Vacant | June, 1840 – December 7, 1840 | |||
 William Whiting Boardman (New Haven |
Whig | December 7, 1840 – March 3, 1843 |
26th 27th |
Elected to finish Storrs's term. Retired. |
| John Stewart (Chatham |
Democratic | March 4, 1843 – March 3, 1845 |
28th | [data unknown/missing] Lost re-election. |
 Samuel Dickinson Hubbard (Middletown |
Whig | March 4, 1845 – March 3, 1849 |
29th 30th |
[data unknown/missing] Retired. |
 Walter Booth (Meriden |
Free Soil | March 4, 1849 – March 3, 1851 |
31st | [data unknown/missing] Lost re-election. |
| Colin M. Ingersoll (New Haven |
Democratic | March 4, 1851 – March 3, 1855 |
32nd 33rd |
[data unknown/missing] Retired. |
 John Woodruff (New Haven |
American | March 4, 1855 – March 3, 1857 |
34th | [data unknown/missing] Lost re-election. |
 Samuel Arnold (Haddam |
Democratic | March 4, 1857 – March 3, 1859 |
35th | [data unknown/missing] Retired. |
John Woodruff (New Haven |
Republican | March 4, 1859 – March 3, 1861 |
36th | [data unknown/missing] Retired. |
 James E. English (New Haven |
Democratic | March 4, 1861 – March 3, 1865 |
37th 38th |
[data unknown/missing] Retired. |
 Samuel L. Warner (Middletown |
Republican | March 4, 1865 – March 3, 1867 |
39th | [data unknown/missing] Retired. |
 Julius Hotchkiss (Waterbury |
Democratic | March 4, 1867 – March 3, 1869 |
40th | [data unknown/missing] Retired. |
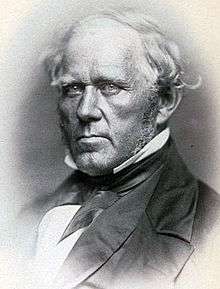
.jpg) Stephen Wright Kellogg (Waterbury |
Republican | March 4, 1869 – March 3, 1875 |
41st 42nd 43rd |
[data unknown/missing] Lost re-election. |
 James Phelps (Essex |
Democratic | March 4, 1875 – March 3, 1883 |
44th 45th 46th 47th |
[data unknown/missing] Retired. |
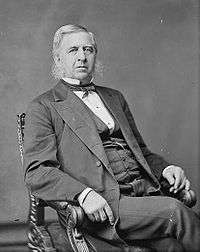
.jpg) Charles Le Moyne Mitchell (New Haven |
Democratic | March 4, 1883 – March 3, 1887 |
48th 49th |
[data unknown/missing] Retired. |
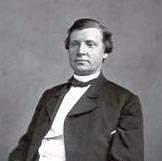
.jpg) Carlos French (Seymour |
Democratic | March 4, 1887 – March 3, 1889 |
50th | [data unknown/missing] Retired. |
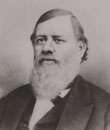
.jpg) Washington F. Willcox (Chester |
Democratic | March 4, 1889 – March 3, 1893 |
51st 52nd |
[data unknown/missing] Retired. |
.jpg) James P. Pigott (New Haven |
Democratic | March 4, 1893 – March 3, 1895 |
53rd | [data unknown/missing] Lost re-election. |
.jpg) Nehemiah D. Sperry (New Haven |
Republican | March 4, 1895 – March 3, 1911 |
54th 55th 56th 57th 58th 59th 60th 61st |
[data unknown/missing] Retired. |
 Thomas L. Reilly (Meriden |
Democratic | March 4, 1911 – March 3, 1913 |
62nd | Re-districted to 3rd district. |
 Bryan F. Mahan (New London |
Democratic | March 4, 1913 – March 3, 1915 |
63rd | [data unknown/missing] Lost re-election. |
 Richard P. Freeman (New London |
Republican | March 4, 1915 – March 3, 1933 |
64th 65th 66th 67th 68th 69th 70th 71st 72nd |
[data unknown/missing] Lost re-election. |
.jpg) William L. Higgins (Coventry |
Republican | March 4, 1933 – January 3, 1937 |
73rd 74th |
[data unknown/missing] Lost re-election. |
| William J. Fitzgerald (Norwich |
Democratic | January 3, 1937 – January 3, 1939 |
75th | [data unknown/missing] Lost re-election. |
| Thomas R. Ball (Old Lyme |
Republican | January 3, 1939 – January 3, 1941 |
76th | [data unknown/missing] Lost re-election. |
| William J. Fitzgerald (Norwich |
Democratic | January 3, 1941 – January 3, 1943 |
77th | [data unknown/missing] Lost re-election. |
| John D. McWilliams (Norwich |
Republican | January 3, 1943 – January 3, 1945 |
78th | [data unknown/missing] Lost re-election. |
 Chase G. Woodhouse (Sprague |
Democratic | January 3, 1945 – January 3, 1947 |
79th | [data unknown/missing] Lost re-election. |
.jpg) Horace Seely-Brown Jr. (Pomfret) |
Republican | January 3, 1947 – January 3, 1949 |
80th | [data unknown/missing] Lost re-election. |
Chase G. Woodhouse (Sprague |
Democratic | January 3, 1949 – January 3, 1951 |
81st | [data unknown/missing] Lost re-election. |
Horace Seely-Brown Jr. (Pomfret |
Republican | January 3, 1951 – January 3, 1959 |
82nd 83rd 84th 85th |
[data unknown/missing] Lost re-election. |
.jpg) Chester Bowles (Essex |
Democratic | January 3, 1959 – January 3, 1961 |
86th | [data unknown/missing] Retired when appointed Under Secretary of State |
Horace Seely-Brown Jr. (Pomfret |
Republican | January 3, 1961 – January 3, 1963 |
87th | Rerired after running for US Senate |
 William St. Onge (Putnam |
Democratic | January 3, 1963 – May 1, 1970 |
88th 89th 90th 91st |
[data unknown/missing] Died. |
| Vacant | May 1, 1970 – November 3, 1970 |
91st | ||
 Robert H. Steele (Vernon |
Republican | November 3, 1970 – January 3, 1975 |
91st 92nd 93rd |
Elected to finish St. Onge's term. Retired after running for List of Governors of Connecticut |
 Chris Dodd (Norwich |
Democratic | January 3, 1975 – January 3, 1981 |
94th 95th 96th |
[data unknown/missing] Retired when elected to the US Senate |
 Sam Gejdenson (Bozrah |
Democratic | January 3, 1981 – January 3, 2001 |
97th 98th 99th 100th 101st 102nd 103rd 104th 105th 106th |
[data unknown/missing] Lost re-election. |
 Rob Simmons (Stonington |
Republican | January 3, 2001 – January 3, 2007 |
107th 108th 109th |
[data unknown/missing] Lost re-election. |
 Joe Courtney (Vernon |
Democratic | January 3, 2007 – Present |
110th 111th 112th 113th 114th 115th 116th |
Elected in 2006. |
References
- https://www.census.gov/mycd/?st=09&cd=02
- "Partisan Voting Index – Districts of the 115th Congress" (PDF). The Cook Political Report. April 7, 2017. Retrieved April 7, 2017.
- "Registration and Party Enrollment Statistics as of October 30, 2012" (PDF). Connecticut Secretary of State. Archived from the original (PDF) on 2006-09-23. Retrieved 2012-10-30.
- "Archived copy" (PDF). Archived from the original (PDF) on 2006-12-16. Retrieved 2006-12-04.CS1 maint: archived copy as title (link) 2006 Official Election Results
- Martis, Kenneth C. (1989). The Historical Atlas of Political Parties in the United States Congress. New York: Macmillan Publishing Company.
- Martis, Kenneth C. (1982). The Historical Atlas of United States Congressional Districts. New York: Macmillan Publishing Company.
- Congressional Biographical Directory of the United States 1774–present