2013 Lombard regional election
The Lombard regional election of 2013 took place on 24 and 25 February 2013 and was the first snap election in Lombard political history, and the first one paired with a general election. The 10th term of the Regional Council was chosen.
| |||||||||||||||||||||||||||||||
All 80 seats to the Regional Council of Lombardy | |||||||||||||||||||||||||||||||
|---|---|---|---|---|---|---|---|---|---|---|---|---|---|---|---|---|---|---|---|---|---|---|---|---|---|---|---|---|---|---|---|
| Turnout | 76.74% ( | ||||||||||||||||||||||||||||||
| |||||||||||||||||||||||||||||||
| |||||||||||||||||||||||||||||||
 |
|---|
| This article is part of a series on the politics and government of Lombardy |
|
Electoral law
Lombardy used for the first time its own legislation to elect its Council, very similar to national Tatarella Law of 1995. The new electoral law was adopted before the resignation of 74 members of the Council on October 26, 2012.[1] While the President of Lombardy and the leader of the opposition are still elected at-large, 78 councillors, instead of 64 as it was before, are elected by party lists under a form of semi-proportional representation. The winning coalition receives a jackpot of at least 45 seats, which are divided between all majority parties using the D'Hondt method, as it happens between the losing lists. Each party then distributes its seats to its provincial lists, where candidates are openly selected.
Campaign
On 16 October 2012, Formigoni announced the dissolution of the regional legislature after one of his commissioners, Domenico Zambetti of the PdL was arrested on accusations he bought votes from the 'Ndrangheta in 2010 and extorted favours and public building contracts, including construction tenders for the World Expo 2015 in Milan.[2][3]
Center-left primary election, 2012
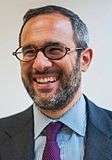
On 15 December 2012 the center-left primary election took place to decide the official candidate of the coalition in the election. There were three candidates: Umberto Ambrosoli, son of Giorgio killed in 1979, Alessandra Kustermann and Andrea Di Stefano. Umberto Ambrosoli received the 57% of the votes and became the center-left official candidate for the regional election.[4]
| Candidate | Votes | % |
|---|---|---|
| Umberto Ambrosoli | 86,732 | 57.66 |
| Andrea Di Stefano | 34,946 | 23.23 |
| Alessandra Kustermann | 28,744 | 19.11 |
| Total | 150,604 | 100.00 |
Candidates for President
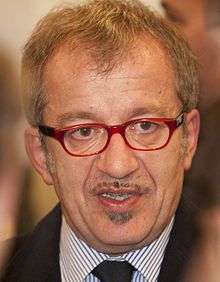
- Roberto Maroni (LN), former Minister of the Interior
- Umberto Ambrosoli (independent member of the PD)
- Gabriele Albertini (SC), MEP and former Mayor of Milan
- Silvana Carcano (M5S)
- Carlo Maria Pinardi (FFD)
Results
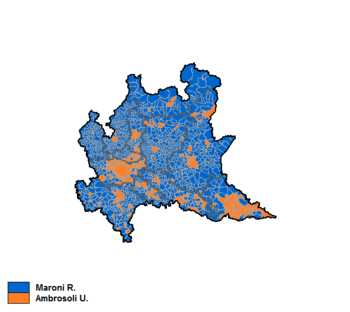
According to the final results, Roberto Maroni was the new President of Lombardy with more than 40% of the votes, obtaining the greater bonus given by the electoral law.
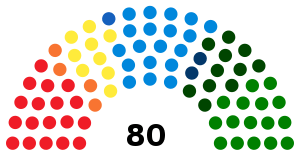 | |||||||||
| Candidates | Votes | % | Seats | Parties | Votes | % | Seat | ||
|---|---|---|---|---|---|---|---|---|---|
| Roberto Maroni | 2,456,921 | 42.82 | 1 | ||||||
| The People of Freedom | 904,742 | 16.73 | 19 | ||||||
| Northern League – Lombard League | 700,907 | 12.96 | 15 | ||||||
| Maroni for President | 552,863 | 10.23 | 11 | ||||||
| Brothers of Italy | 83,810 | 1.55 | 2 | ||||||
| Pensioners' Party | 50,843 | 0.94 | 1 | ||||||
| Labour and Freedom List | 27,374 | 0.51 | – | ||||||
| Ecological Alliance | 8,270 | 0.15 | – | ||||||
| Total | 2,328,809 | 43.07 | 48 | ||||||
| Umberto Ambrosoli | 2,194,169 | 38.24 | 1 | ||||||
| Democratic Party | 1,369,440 | 25.33 | 17 | ||||||
| Ambrosoli for President – Civic Pact | 380,241 | 7.03 | 4 | ||||||
| Left Ecology Freedom | 97,627 | 1.81 | – | ||||||
| Lombard Popular Centre | 63,885 | 1.18 | – | ||||||
| Ethical to the Left | 52,152 | 0.96 | – | ||||||
| Italy of Values | 35,141 | 0.65 | – | ||||||
| Italian Socialist Party | 16,624 | 0.31 | – | ||||||
| Total | 2,015,110 | 37.27 | 21 | ||||||
| Silvana Carcano | 782,007 | 13.63 | – | Five Star Movement | 775,211 | 14.34 | 9 | ||
| Gabriele Albertini | 236,597 | 4.12 | – | ||||||
| Civic Lombardy | 133,435 | 2.47 | – | ||||||
| Union of the Centre | 85,721 | 1.59 | – | ||||||
| Total | 219,156 | 4.05 | – | ||||||
| Carlo Pinardi | 68,133 | 1.19 | – | Act to Stop the Decline | 68,469 | 1.27 | – | ||
| Total candidates | 5,737,827 | 100.00 | 2 | Total parties | 5,406,755 | 100.00 | 78 | ||
| Source: Ministry of the Interior – Historical Archive of Elections | |||||||||
Results by province
| Province | Roberto Maroni | Umberto Ambrosoli | Silvana Carcano | Gabriele Albertini | Carlo Pinardi |
Turnout |
|---|---|---|---|---|---|---|
| Milan | 654,388 (36.25%) | 795,290 (44.18%) | 245,753 (13.65%) | 84,136 (4.67%) | 20,456 (1.14%) | 76.48% |
| Brescia | 346,234 (47.52%) | 250,248 (34.25%) | 93,315 (12.81%) | 29,215 (4.01%) | 9,608 (1.32%) |
80.58% |
| Bergamo | 315,372 (49.16%) | 221,301 (34.50%) | 72,608 (11.32%) | 22,861 (3.56%) | 9,330 (1.45%) |
78.59% |
| Varese | 241,138 (47.49%) | 169,966 (33.47%) | 70,661 (13.92%) | 21,024 (4.14%) | 5,010 (0.99%) |
73.11% |
| Monza and Brianza | 216,112 (42.14%) | 193,041 (37.64%) | 76,307 (14.88%) | 20,856 (4.07%) | 6,559 (1.28%) |
78.95% |
| Como | 166,302 (48.70%) | 114,630 (33.57%) | 43,532 (12.75%) | 13,230 (3.87%) | 3,762 (1.10%) |
72.20% |
| Pavia | 138,333 (43.78%) | 114,386 (36.20%) | 49,300 (15.60%) | 10,646 (3.37%) | 3,308 (1.05%) |
74.59% |
| Mantua | 89,032 (37.38%) | 95,268 (40.00%) | 42,975 (18.04%) | 8,170 (3.43%) |
2,738 (1.15%) |
76.84% |
| Cremona | 92,458 (43.30%) | 79,934 (37.43%) | 30,769 (14.41%) | 8,081 (3.78%) |
2,305 (1.08%) |
78.27% |
| Lecco | 86,685 (43.24%) | 77,326 (38.58%) | 25,217 (12.58%) | 8,497 (4.24%) |
2,726 (1.36%) |
77.41% |
| Lodi | 56,278 (42.91%) | 48,750 (37.17%) | 19,994 (15.24%) | 4,888 (3.73%) |
1,255 (0.96%) |
79.19% |
| Sondrio | 54,589 (51.37%) | 34,026 (32.02%) | 11,576 (10.89%) | 4,993 (4.70%) |
1,076 (1.01%) |
68.54% |
Results by capital city
| City | Roberto Maroni | Umberto Ambrosoli | Silvana Carcano | Gabriele Albertini | Carlo Pinardi |
Turnout |
|---|---|---|---|---|---|---|
| Milan | 246,918 (34.45%) | 346,495 (48.35%) | 71,430 (9.97%) | 41,890 (5.85%) | 9,910 (1.38%) |
73.63% |
| Brescia | 42,623 (38.71%) | 49,453 (44.91%) | 11,993 (10.89%) | 4,391 (3.99%) |
1,659 (1.51%) |
79.76% |
| Monza | 27,150 (38.09%) | 30,696 (43.07%) | 9,037 (12.68%) |
3,237 (4.54%) |
1,154 (1.62%) |
77.59% |
| Bergamo | 25,709 (37.55%) | 32,108 (46.90%) | 6,184 (9.03%) |
3,007 (4.39%) |
1,449 (2.12%) |
77.06% |
| Como | 18,567 (40.68%) | 19,168 (42.00%) | 5,115 (11.21%) |
2,203 (4.83%) |
590 (1.29%) |
67.47% |
| Varese | 20,853 (46.84%) | 16,774 (37.68%) | 4,227 (9.61%) |
2,084 (4.68%) |
530 (1.19%) |
70.02% |
| Pavia | 16,704 (38.72%) | 19,111 (44.30%) | 4,993 (11.57%) |
1,675 (3.88%) |
658 (1.53%) |
76.60% |
| Cremona | 15,258 (36.18%) | 18,583 (44.06%) | 6,281 (14.89%) |
1,585 (3.76%) |
467 (1.11%) |
78.16% |
| Mantua | 8,326 (29.65%) |
14,063 (50.08%) | 4,235 (15.08%) |
994 (3.54%) |
462 (1.65%) |
75.49% |
| Lecco | 10,829 (38.50%) | 12,470 (44.34%) | 3,101 (11.03%) |
1,335 (4.75%) |
390 (1.39%) |
76.33% |
| Lodi | 10,208 (39.53%) | 11,358 (43.99%) | 2,800 (10.84%) |
1,130 (4.38%) |
325 (1.26%) |
78.78% |
| Sondrio | 4,749 (37.30%) |
5,369 (42.17%) | 1,672 (13.13%) |
700 (5.50%) |
242 (1.90%) |
71.29% |
Seats by province
| Province | PD | LN/Maroni List | PdL | M5S | Ambrosoli List | FdI | Others | Total |
|---|---|---|---|---|---|---|---|---|
| Milan | 5 | 7 | 5 | 3 | 2 | 1 | 1 | 24 |
| Brescia | 2 | 4 | 2 | 1 | 1 | - | - | 10 |
| Bergamo | 2 | 3 | 2 | 1 | 1 | - | - | 9 |
| Varese | 1 | 3 | 2 | 1 | - | - | - | 7 |
| Monza and Brianza | 2 | 2 | 2 | 1 | - | - | - | 7 |
| Como | 1 | 2 | 1 | - | - | 1 | - | 5 |
| Pavia | 1 | 1 | 1 | 1 | - | - | - | 4 |
| Cremona | 1 | 1 | 1 | - | - | - | - | 3 |
| Lecco | 1 | 1 | 1 | - | - | - | - | 3 |
| Mantua | 1 | - | 1 | 1 | - | - | - | 3 |
| Lodi | - | 1 | 1 | - | - | - | - | 2 |
| Sondrio | - | 1 | - | - | - | - | - | 1 |
| Total | 17 | 26 | 19 | 9 | 4 | 2 | 1 | 78 |
References
- La Repubblica, October 26, 2012.
- Italy corruption probes claim Lombardy legislature, Miami Herald, 16 October 2012
- Mafia probe claims political victim, Financial Times, 14 October 2012
- La Repubblica, December 16, 2012.
