1985 Lombard regional election
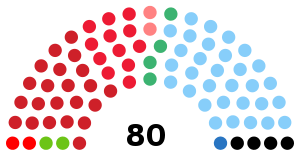
The Lombard regional election of 1985 took place on 12 May 1985. The 4th term of the Regional Council was chosen.
| |||||||||||||||||||||||||||||||||
All 80 seats to the Regional Council of Lombardy | |||||||||||||||||||||||||||||||||
|---|---|---|---|---|---|---|---|---|---|---|---|---|---|---|---|---|---|---|---|---|---|---|---|---|---|---|---|---|---|---|---|---|---|
| Turnout | 92.81% | ||||||||||||||||||||||||||||||||
| |||||||||||||||||||||||||||||||||
| |||||||||||||||||||||||||||||||||
 |
|---|
| This article is part of a series on the politics and government of Lombardy |
|
Electoral law
Election was held under proportional representation with provincial constituencies where the largest remainder method with a Droop quota was used. To ensure more proportionality, remained votes and seats were transferred at regional level and calculated at-large.
Results
The Christian Democracy party was by far the largest party, despite a slight decline in term of votes. After the election Giuseppe Guzzetti was re-elected president for the third time at the head of a center-left coalition comprising also the PSI, the PSDI, the PLI and the PRI. In 1986 Guzzetti was replaced by Bruno Tabacci, to whom Giuseppe Giovenzana succeeded in 1989.
 | ||||
| Parties | Votes | % | Seats | |
|---|---|---|---|---|
| Christian Democracy | 2,204,685 | 36.03 | 31 | |
| Italian Communist Party | 1,632,676 | 26.68 | 22 | |
| Italian Socialist Party | 941,395 | 15.38 | 12 | |
| Italian Social Movement | 363,918 | 5.95 | 4 | |
| Italian Republican Party | 293,359 | 4.79 | 4 | |
| Italian Democratic Socialist Party | 170.763 | 2.79 | 2 | |
| Green Lists | 146,835 | 2.40 | 2 | |
| Italian Liberal Party | 143,641 | 2.35 | 1 | |
| Proletarian Democracy | 136,781 | 2.24 | 2 | |
| National Pensioners' Party | 32,945 | 0.54 | – | |
| Lega Lombarda (incl. LV) | 28,074 | 0.46 | – | |
| UV–PD–UPAP–Ecologia | 15,475 | 0.25 | – | |
| Humanist Party | 4,448 | 0.07 | – | |
| Monarchist National Party | 4,352 | 0.07 | – | |
| Total parties | 6,119,347 | 100.00 | 80 | |
| Invalid/blank votes | 331,013 | |||
| Registered voters | 6,450,360 | 92.81 | ||
| Source: Ministry of the Interior – Results | ||||
|}
Seats by province
| Province | DC | PCI | PSI | MSI | PRI | PSDI | Greens | PLI | DP | Total |
|---|---|---|---|---|---|---|---|---|---|---|
| Milan | 11 | 11 | 6 | 2 | 3 | 1 | 1 | 1 | 1 | 37 |
| Brescia | 4 | 2 | 1 | 1 | - | 1 | 1 | - | - | 10 |
| Bergamo | 5 | 2 | 1 | - | - | - | - | - | 1 | 9 |
| Varese | 3 | 2 | 1 | 1 | 1 | - | - | - | - | 8 |
| Como | 3 | 1 | 1 | - | - | - | - | - | - | 5 |
| Pavia | 2 | 2 | 1 | - | - | - | - | - | - | 5 |
| Mantua | 1 | 1 | 1 | - | - | - | - | - | - | 3 |
| Cremona | 1 | 1 | - | - | - | - | - | - | - | 2 |
| Sondrio | 1 | - | - | - | - | - | - | - | - | 1 |
| Total | 31 | 22 | 12 | 4 | 4 | 2 | 2 | 1 | 2 | 80 |

