1987 Plymouth City Council election
The 1987 Plymouth City Council election took place on 7 May 1987 to elect members of Plymouth City Council in Devon, England. This was on the same day as other local elections. The Conservative Party retained control of the council, which it had held since its creation in 1973.[1]
| |||||||||||||||||||||||||||||||||
All 60 seats in the Plymouth City Council 31 seats needed for a majority | |||||||||||||||||||||||||||||||||
|---|---|---|---|---|---|---|---|---|---|---|---|---|---|---|---|---|---|---|---|---|---|---|---|---|---|---|---|---|---|---|---|---|---|
| |||||||||||||||||||||||||||||||||
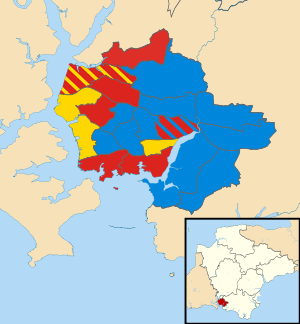 Map showing the results of the 1987 Plymouth City Council elections. | |||||||||||||||||||||||||||||||||
| |||||||||||||||||||||||||||||||||
Overall results
| Party | Seats | Gains | Losses | Net gain/loss | Seats % | Votes % | Votes | +/− | |
|---|---|---|---|---|---|---|---|---|---|
| Conservative | 31 | 3 | 6 | 51.7 | 37.8 | 35,136 | |||
| Labour | 19 | 1 | 5 | 31.7 | 27.6 | 25,617 | |||
| Alliance | 10 | 10 | 0 | 16.7 | 33.1 | 30,779 | |||
| Green | 0 | 0 | 0 | 0.0 | 1.5 | 1,440 | |||
| Total | 60 | 92,972 | |||||||
Ward results
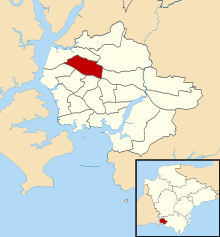
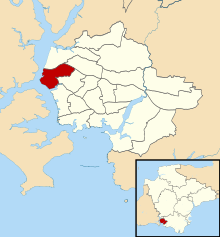
Budshead (3 seats)
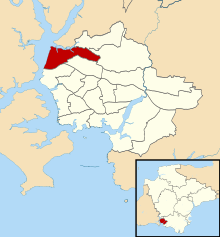
Location of Budshead ward
| Party | Candidate | Votes | % | |
|---|---|---|---|---|
| Labour | E. Thomas | 1,758 | ||
| Alliance | C. Brampton | 1,712 | ||
| Labour | C. Payne | 1,685 | ||
| Labour | R. Simmonds | 1,668 | ||
| Alliance | D. Goodwins | 1,654 | ||
| Alliance | J. Aarons | 1,654 | ||
| Conservative | M. Gibson | 765 | ||
| Conservative | S. Medland | 695 | ||
| Conservative | L. Moss | 660 | ||
| Turnout | 46.9% | |||
| Labour hold | ||||
| Alliance gain from Labour | ||||
| Labour hold | ||||
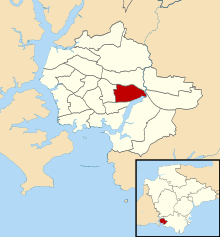
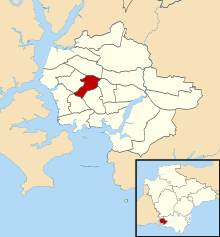
Compton (3 seats)
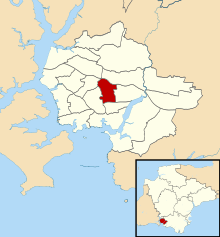
Location of Compton ward
| Party | Candidate | Votes | % | |
|---|---|---|---|---|
| Conservative | T. Savery | 2,537 | ||
| Conservative | G. Sloggett | 2,519 | ||
| Conservative | P. Wood | 2,377 | ||
| Alliance | M. Bayne | 1,390 | ||
| Alliance | B. Clarke | 1,375 | ||
| Alliance | J. Knight | 1,248 | ||
| Labour | M. Seabrook | 463 | ||
| Labour | T. Brown | 450 | ||
| Labour | P. Lee | 443 | ||
| Green | C. Farr | 311 | ||
| Turnout | 54.9% | |||
| Conservative hold | ||||
| Conservative hold | ||||
| Conservative hold | ||||
Drake (3 seats)
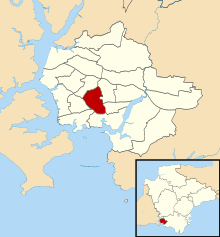
Location of Drake ward
| Party | Candidate | Votes | % | |
|---|---|---|---|---|
| Conservative | D. Mitchell | 2,285 | ||
| Conservative | S. Hole | 1,991 | ||
| Conservative | J. Thorpe | 1,991 | ||
| Alliance | J. Robins | 1,318 | ||
| Alliance | D. Nash | 1,300 | ||
| Alliance | R. Lethaby | 1,211 | ||
| Labour | R. Cooksley | 1,091 | ||
| Labour | L. Haines | 1,016 | ||
| Labour | L. Jarvie | 893 | ||
| Green | G. Grindrod | 292 | ||
| Turnout | 53.0% | |||
| Conservative hold | ||||
| Conservative hold | ||||
| Conservative hold | ||||
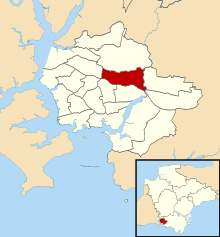
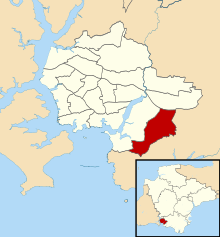
Efford (3 seats)
Location of Efford ward
| Party | Candidate | Votes | % | |
|---|---|---|---|---|
| Labour | R. King | 1,843 | ||
| Labour | G. Draper | 1,667 | ||
| Conservative | C. Stanbury | 1,624 | ||
| Labour | M. Leaves | 1,534 | ||
| Conservative | B. Dawe | 1,500 | ||
| Conservative | K. Banks | 1,496 | ||
| Alliance | P. Howard | 1,084 | ||
| Alliance | J. Cornish | 1,024 | ||
| Alliance | M. Cload | 1,018 | ||
| Turnout | 52.2% | |||
| Labour hold | ||||
| Labour hold | ||||
| Conservative hold | ||||
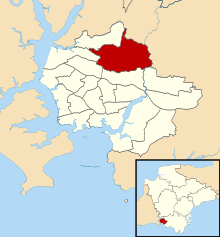
Eggbuckland (3 seats)
Location of Eggbuckland ward
| Party | Candidate | Votes | % | |
|---|---|---|---|---|
| Conservative | J. Pascoe | 2,227 | ||
| Conservative | R. Morrell | 2,147 | ||
| Conservative | D. Mackinem | 2,025 | ||
| Alliance | B. Coe | 1,919 | ||
| Alliance | J. Harris | 1,823 | ||
| Alliance | A. Nelmes | 1,783 | ||
| Labour | M. Hughes | 1,344 | ||
| Labour | L. Huckett | 1,194 | ||
| Labour | P. Williams | 1,150 | ||
| Turnout | 55.6% | |||
| Conservative hold | ||||
| Conservative hold | ||||
| Conservative hold | ||||
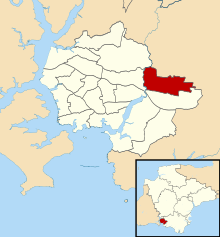
Estover (3 seats)
Location of Estover ward
| Party | Candidate | Votes | % | |
|---|---|---|---|---|
| Conservative | T. Jones | 2,419 | ||
| Conservative | R. Boyes | 2,343 | ||
| Conservative | K. Wigens | 2,281 | ||
| Alliance | A. Ford | 2,124 | ||
| Alliance | G. Gardiner | 2,010 | ||
| Alliance | E. Lindley | 1,983 | ||
| Labour | M. Gilbert | 990 | ||
| Labour | M. Keane | 911 | ||
| Labour | D. Camp | 888 | ||
| Turnout | 51.2% | |||
| Conservative hold | ||||
| Conservative hold | ||||
| Conservative hold | ||||
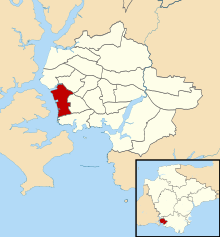
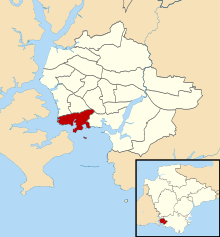
Ham (3 seats)
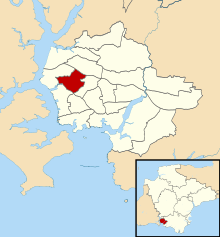
Location of Ham ward
| Party | Candidate | Votes | % | |
|---|---|---|---|---|
| Labour | A. Floyd | 2,181 | ||
| Labour | C. Brimblecombe | 1,930 | ||
| Labour | B. Hendy | 1,823 | ||
| Alliance | A. Burdess | 1,323 | ||
| Alliance | G. Morris | 1,275 | ||
| Alliance | M. Pike | 1,192 | ||
| Conservative | M. Baxter | 994 | ||
| Conservative | P. Gale | 920 | ||
| Conservative | K. Waterman | 880 | ||
| Turnout | 53.6% | |||
| Labour hold | ||||
| Labour hold | ||||
| Labour hold | ||||
Honicknowle (3 seats)
Location of Honicknowle ward
| Party | Candidate | Votes | % | |
|---|---|---|---|---|
| Labour | P. Whitfield | 2,525 | ||
| Labour | J. Ingham | 2,487 | ||
| Labour | H. Dolley | 2,411 | ||
| Conservative | D. Kennedy | 1,124 | ||
| Conservative | A. Ayres | 1,064 | ||
| Conservative | M. Waterman | 1,054 | ||
| Alliance | S. Parry | 1,034 | ||
| Alliance | W. Lea | 1,008 | ||
| Alliance | J. House | 1,002 | ||
| Turnout | 59.3% | |||
| Labour hold | ||||
| Labour hold | ||||
| Labour hold | ||||
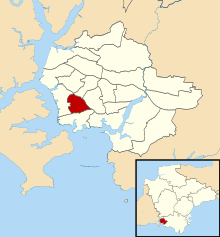
Keyham (3 seats)
Location of Keyham ward
| Party | Candidate | Votes | % | |
|---|---|---|---|---|
| Alliance | H. Furzeman | 1,546 | ||
| Alliance | I. Higgins | 1,539 | ||
| Alliance | L. Woodcock | 1,428 | ||
| Labour | A. Bennett | 1,372 | ||
| Labour | D. Manley | 1,295 | ||
| Labour | R. Lemin | 1,275 | ||
| Conservative | H. Fox | 1,163 | ||
| Conservative | D. Ackland | 1,126 | ||
| Conservative | R. Johnson | 1,075 | ||
| Turnout | 47.1% | |||
| Alliance gain from Conservative | ||||
| Alliance gain from Conservative | ||||
| Alliance gain from Labour | ||||
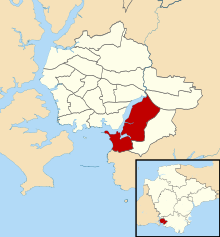
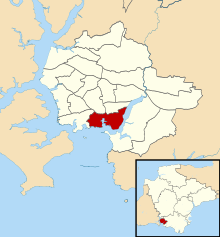
Mount Gould (3 seats)
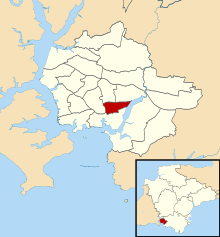
Location of Mount Gould ward
| Party | Candidate | Votes | % | |
|---|---|---|---|---|
| Alliance | Gary Streeter | 1,841 | ||
| Alliance | V. Hoy | 1,720 | ||
| Alliance | A. Pawley | 1,664 | ||
| Conservative | J. Courtney | 1,312 | ||
| Conservative | M. Glanville | 1,200 | ||
| Conservative | J. Wallace | 1,136 | ||
| Labour | T. Evans | 911 | ||
| Labour | N. Skinner | 874 | ||
| Labour | A. Westlake | 857 | ||
| Turnout | 50.7% | |||
| Alliance gain from Conservative | ||||
| Alliance gain from Conservative | ||||
| Alliance gain from Conservative | ||||
Plympton Erle (3 seats)
Location of Plympton Erle ward
| Party | Candidate | Votes | % | |
|---|---|---|---|---|
| Conservative | J. Mills | 2,178 | ||
| Conservative | A. Wright | 2,133 | ||
| Conservative | J. Richards | 2,089 | ||
| Alliance | M. Williams | 1,861 | ||
| Alliance | P. Willcock | 1,798 | ||
| Alliance | A. Cudmore | 1,797 | ||
| Labour | J. Fildew | 577 | ||
| Labour | L. Glover | 502 | ||
| Labour | P. Johns | 501 | ||
| Turnout | 43.7% | |||
| Conservative hold | ||||
| Conservative hold | ||||
| Conservative hold | ||||
Plympton St Mary (3 seats)
Location of Plympton St Mary ward
| Party | Candidate | Votes | % | |
|---|---|---|---|---|
| Conservative | J. Stopporton | 2,398 | ||
| Conservative | J. Philpotts | 2,297 | ||
| Conservative | O. Hughes | 2,153 | ||
| Alliance | P. Radmore | 2,138 | ||
| Alliance | M. Hendley | 1,961 | ||
| Alliance | J. Hendley | 1,864 | ||
| Labour | D. Mills | 518 | ||
| Labour | M. Nix | 449 | ||
| Labour | H. Welch | 436 | ||
| Turnout | 54.4% | |||
| Conservative gain from Ind. Conservative | ||||
| Conservative gain from Ind. Conservative | ||||
| Conservative gain from Ind. Conservative | ||||
Plymstock Dunstone (3 seats)
Location of Plymstock Dunstone ward
| Party | Candidate | Votes | % | |
|---|---|---|---|---|
| Conservative | D. Dicker | 2,867 | ||
| Conservative | D. Viney | 2,758 | ||
| Conservative | P. Hocken | 2,699 | ||
| Alliance | J. Woodcock | 1,846 | ||
| Alliance | E. Willcock | 1,766 | ||
| Alliance | A. Martin | 1,675 | ||
| Labour | R. Gachagen | 499 | ||
| Labour | W. Finn | 484 | ||
| Labour | G. Payne | 466 | ||
| Turnout | 53.0% | |||
| Conservative hold | ||||
| Conservative hold | ||||
| Conservative hold | ||||
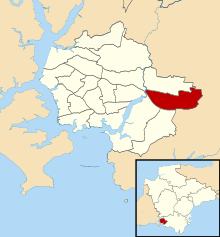
Plymstock Radford (3 seats)
Location of Plymstock Radford ward
| Party | Candidate | Votes | % | |
|---|---|---|---|---|
| Conservative | C. Easton | 2,472 | ||
| Conservative | S. Radford | 2,183 | ||
| Conservative | K. Moyse | 2,122 | ||
| Alliance | R. Snell | 1,261 | ||
| Alliance | G. Unwin | 1,239 | ||
| Alliance | J. Byatt | 1,208 | ||
| Labour | R. Earl | 828 | ||
| Labour | I. Gasper | 637 | ||
| Labour | N. Mallett | 603 | ||
| Turnout | 52.9% | |||
| Conservative hold | ||||
| Conservative hold | ||||
| Conservative hold | ||||
Southway (3 seats)
Location of Southway ward
| Party | Candidate | Votes | % | |
|---|---|---|---|---|
| Labour | R. Scott | 1,791 | ||
| Labour | W. Evans | 1,771 | ||
| Labour | J. Jones | 1,670 | ||
| Alliance | W. Cornish | 1,483 | ||
| Alliance | D. Elliott | 1,482 | ||
| Alliance | C. Andrews | 1,449 | ||
| Conservative | S. Jones | 1,348 | ||
| Conservative | A. Marshall-Clarke | 1,266 | ||
| Conservative | A. Sloggett | 1,260 | ||
| Turnout | 44.2% | |||
| Labour hold | ||||
| Labour hold | ||||
| Labour hold | ||||
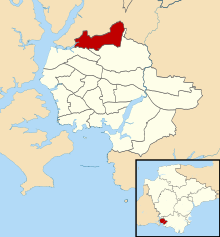
St Budeax (3 seats)
Location of St Budeax ward
| Party | Candidate | Votes | % | |
|---|---|---|---|---|
| Alliance | B. Luscombe | 1,709 | ||
| Alliance | J. Luscombe | 1,580 | ||
| Alliance | W. Gallagher | 1,514 | ||
| Labour | W. Goffin | 1,292 | ||
| Labour | S. Cresswell | 1,272 | ||
| Labour | B. Gilroy | 1,193 | ||
| Conservative | J. Horswell | 1,166 | ||
| Conservative | M. Maddock | 1,155 | ||
| Conservative | F. Sullivan | 1,133 | ||
| Turnout | 48.1% | |||
| Alliance gain from Labour | ||||
| Alliance gain from Labour | ||||
| Alliance gain from Labour | ||||
St Peter (3 seats)
Location of St Peter ward
| Party | Candidate | Votes | % | |
|---|---|---|---|---|
| Labour | S. Bellamy | 1,744 | ||
| Labour | G. Clinick | 1,636 | ||
| Labour | P. Kelly | 1,505 | ||
| Alliance | G. Burns | 831 | ||
| Conservative | M. Chapman | 825 | ||
| Conservative | J. Mahony | 791 | ||
| Alliance | K. Pedrick | 776 | ||
| Conservative | C. Fowler | 768 | ||
| Alliance | B. Harris | 739 | ||
| Green | S. Shaw | 206 | ||
| Turnout | 43.6% | |||
| Labour hold | ||||
| Labour hold | ||||
| Labour hold | ||||
Stoke (3 seats)
Location of Stoke ward
| Party | Candidate | Votes | % | |
|---|---|---|---|---|
| Conservative | C. Pascoe | 2,137 | ||
| Conservative | J. Howe | 1,928 | ||
| Conservative | G. Monahan | 1,865 | ||
| Alliance | P. Nicholson | 1,741 | ||
| Alliance | G. Airey | 1,589 | ||
| Alliance | G. Pedrick | 1,471 | ||
| Labour | G. Wheeler | 1,301 | ||
| Labour | S. Smith | 1,255 | ||
| Labour | M. Wright | 1,199 | ||
| Green | F. Allen | 275 | ||
| Turnout | 57.3% | |||
| Conservative hold | ||||
| Conservative hold | ||||
| Conservative hold | ||||
Sutton (3 seats)
Location of Sutton ward
| Party | Candidate | Votes | % | |
|---|---|---|---|---|
| Labour | J. Finnigan | 1,437 | ||
| Labour | C. Mavin | 1,342 | ||
| Labour | J. Nelder | 1,338 | ||
| Alliance | P. York | 1,230 | ||
| Alliance | R. Kaye | 1,180 | ||
| Alliance | R. Goodinson | 1,170 | ||
| Conservative | P. Bentley | 1,163 | ||
| Conservative | G. Blades | 1,161 | ||
| Conservative | R. Browne | 1,127 | ||
| Turnout | 47.8% | |||
| Labour hold | ||||
| Labour hold | ||||
| Labour gain from Conservative | ||||
Trelawny (3 seats)
Location of Trelawny ward
| Party | Candidate | Votes | % | |
|---|---|---|---|---|
| Conservative | R. Mahoney | 2,132 | ||
| Conservative | T. Drean | 2,051 | ||
| Conservative | A. Parish | 2,026 | ||
| Alliance | C. May | 1,388 | ||
| Alliance | J. Green | 1,368 | ||
| Alliance | A. McKelvie | 1,294 | ||
| Labour | J. Blower | 1,152 | ||
| Labour | N. Brimblecombe | 1,049 | ||
| Labour | B. Rider | 1,025 | ||
| Green | T. Barber | 356 | ||
| Turnout | 63.8% | |||
| Conservative hold | ||||
| Conservative hold | ||||
| Conservative hold | ||||
gollark: Ah, it appears that I am *incapable* of reading.
gollark: Or possibly coltrans/olivia, i.e. the generally competent people.
gollark: I suspect this is quintopia.
gollark: +**5**?!
gollark: Wow, impressive.
References
- "Council Compositions by Year". The Elections Centre.
| Metropolitan boroughs |
|
|---|---|
| District councils (England) |
|
| District councils (Wales) |
|
| |
This article is issued from Wikipedia. The text is licensed under Creative Commons - Attribution - Sharealike. Additional terms may apply for the media files.