1996 United States presidential election in North Dakota
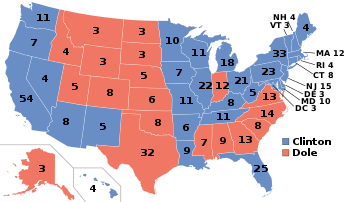
The 1996 United States presidential election in North Dakota took place on November 5, 1996. All 50 states and the District of Columbia, were part of the 1996 United States presidential election. State voters chose 3 electors to the Electoral College, which selected the president and vice president.
| |||||||||||||||||||||||||||||||||
| |||||||||||||||||||||||||||||||||
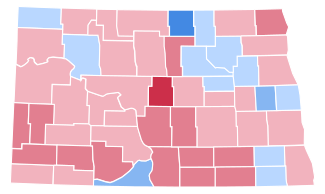 County Results
| |||||||||||||||||||||||||||||||||
| |||||||||||||||||||||||||||||||||


| Elections in North Dakota | ||||||
|---|---|---|---|---|---|---|
 | ||||||
|
||||||
|
||||||
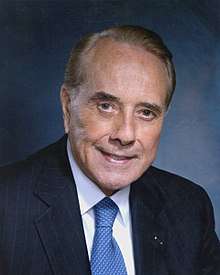
North Dakota was won by Kansas Senator Bob Dole, who was running against incumbent United States President Bill Clinton of Arkansas. Clinton ran a second time with former Tennessee Senator and Al Gore as Vice President, and Dole ran with former New York Congressman Jack Kemp.[1]
North Dakota weighed in for this election as 5% more third-party than the national average.
Partisan background
The presidential election of 1996 was a very multi-partisan election for North Dakota, with almost 13% of the electorate voting for third-party candidates. All major counties in North Dakota turned out for Dole, including the (relativity) highly populated center of Cass County, which contains the city of Fargo.
In his second bid for the presidency, Ross Perot led the newly reformed Reform Party to gain over 12% of the votes in North Dakota, and to pull in support nationally as the most popular third-party candidate to run for United States Presidency in recent times. His performance in the state was his fifth strongest in the election after Maine, Montana, Idaho and Wyoming.[2]
As of the 2016 presidential election, this is the last election in which Divide County and Ramsey County voted for the Democratic candidate.
Results
| 1996 United States presidential election in North Dakota | ||||||
|---|---|---|---|---|---|---|
| Party | Candidate | Votes | Percentage | Electoral votes | ||
| Republican | Bob Dole | 125,050 | 46.94% | 3 | ||
| Democratic | Bill Clinton | 106,905 | 40.13% | 0 | ||
| Reform | Ross Perot | 32,515 | 12.20% | 0 | ||
| Libertarian | Harry Browne | 847 | 0.32% | 0 | ||
| Taxpayers’ | Howard Phillips | 745 | 0.28% | 0 | ||
| Natural Law | Dr. John Hagelin | 349 | 0.13% | 0 | ||
| Totals | 266,411 | 100.00% | 3 | |||
| Voter Turnout (Voting age/Registered) | ||||||
By county
| County | Clinton% | Clinton# | Dole% | Dole# | Others% | Others# |
|---|---|---|---|---|---|---|
| Adams | 31.8% | 366 | 49.9% | 575 | 18.3% | 211 |
| Barnes | 42.4% | 2,317 | 44.8% | 2,449 | 12.8% | 702 |
| Benson | 48.8% | 1,059 | 39.1% | 850 | 12.1% | 263 |
| Billings | 22.9% | 116 | 55.4% | 281 | 21.7% | 110 |
| Bottineau | 36.4% | 1,280 | 47.8% | 1,682 | 15.8% | 557 |
| Bowman | 33.2% | 489 | 48.2% | 710 | 18.6% | 274 |
| Burke | 38.2% | 416 | 44.4% | 483 | 17.5% | 190 |
| Burleigh | 35.7% | 10,679 | 51.7% | 15,464 | 12.5% | 3,747 |
| Cass | 43.0% | 21,693 | 48.0% | 24,238 | 9.0% | 4,540 |
| Cavalier | 37.9% | 941 | 47.9% | 1,188 | 14.3% | 354 |
| Dickey | 35.8% | 953 | 53.2% | 1,418 | 11.0% | 294 |
| Divide | 47.5% | 637 | 36.4% | 488 | 16.1% | 215 |
| Dunn | 33.7% | 587 | 47.6% | 830 | 18.7% | 326 |
| Eddy | 43.2% | 553 | 40.4% | 517 | 16.5% | 211 |
| Emmons | 25.4% | 544 | 53.5% | 1,148 | 21.1% | 452 |
| Foster | 38.1% | 664 | 45.9% | 801 | 16.0% | 279 |
| Golden Valley | 25.4% | 235 | 56.3% | 520 | 18.3% | 169 |
| Grand Forks | 44.0% | 11,376 | 44.9% | 11,606 | 11.1% | 2,854 |
| Grant | 21.9% | 300 | 55.5% | 760 | 22.6% | 309 |
| Griggs | 42.7% | 670 | 46.5% | 731 | 10.8% | 170 |
| Hettinger | 29.3% | 418 | 53.7% | 765 | 17.0% | 243 |
| Kidder | 31.4% | 434 | 50.0% | 691 | 18.6% | 257 |
| LaMoure | 36.9% | 880 | 51.2% | 1,220 | 12.0% | 285 |
| Logan | 27.1% | 360 | 53.1% | 705 | 19.8% | 263 |
| McHenry | 39.8% | 1,096 | 43.1% | 1,187 | 17.2% | 473 |
| McIntosh | 26.4% | 470 | 56.4% | 1,005 | 17.2% | 306 |
| McKenzie | 34.3% | 928 | 49.5% | 1,338 | 16.2% | 437 |
| McLean | 40.2% | 1,759 | 45.4% | 1,988 | 14.5% | 633 |
| Mercer | 32.2% | 1,300 | 48.3% | 1,953 | 19.5% | 789 |
| Morton | 37.2% | 3,745 | 46.7% | 4,699 | 16.2% | 1,626 |
| Mountrail | 48.8% | 1,277 | 36.9% | 965 | 14.3% | 373 |
| Nelson | 46.0% | 827 | 41.4% | 745 | 12.6% | 227 |
| Oliver | 32.6% | 333 | 48.8% | 499 | 18.6% | 190 |
| Pembina | 36.2% | 1,191 | 50.9% | 1,678 | 12.9% | 425 |
| Pierce | 34.0% | 671 | 51.5% | 1,017 | 14.5% | 286 |
| Ramsey | 44.5% | 2,123 | 43.5% | 2,077 | 12.0% | 574 |
| Ransom | 49.2% | 1,199 | 37.8% | 920 | 13.0% | 316 |
| Renville | 41.5% | 562 | 42.5% | 576 | 16.0% | 216 |
| Richland | 40.9% | 2,890 | 47.3% | 3,345 | 11.8% | 834 |
| Rolette | 63.8% | 2,299 | 22.9% | 823 | 13.3% | 479 |
| Sargent | 48.5% | 1,003 | 39.4% | 814 | 12.1% | 250 |
| Sheridan | 26.8% | 252 | 60.2% | 566 | 13.1% | 123 |
| Sioux | 57.0% | 393 | 30.0% | 207 | 13.0% | 90 |
| Slope | 27.6% | 123 | 58.4% | 260 | 13.9% | 62 |
| Stark | 35.6% | 3,095 | 46.9% | 4,086 | 17.5% | 1,524 |
| Steele | 50.6% | 620 | 39.7% | 486 | 9.7% | 119 |
| Stutsman | 41.8% | 3,589 | 44.0% | 3,784 | 14.2% | 1,220 |
| Towner | 46.8% | 649 | 39.1% | 542 | 14.1% | 196 |
| Traill | 45.1% | 1,822 | 45.0% | 1,820 | 9.9% | 400 |
| Walsh | 42.2% | 2,082 | 45.0% | 2,222 | 12.9% | 635 |
| Ward | 39.4% | 8,660 | 48.0% | 10,546 | 12.6% | 2,758 |
| Wells | 37.8% | 962 | 46.9% | 1,192 | 15.3% | 388 |
| Williams | 38.5% | 3,018 | 45.8% | 3,590 | 15.7% | 1,232 |
See also
References
- "Dave Leip's Atlas of U.S. Presidential Elections". Uselectionatlas.org. Retrieved 2013-07-21.
- "1996 Presidential Election Statistics". Dave Leip’s Atlas of U.S. Presidential Elections. Retrieved 2018-03-05.