1996 United States presidential election in Nevada
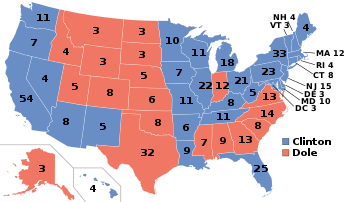
The 1996 United States presidential election in Nevada took place on November 5, 1996, as part of the 1996 United States presidential election. Voters chose four representatives, or electors to the Electoral College, who voted for president and vice president.
| |||||||||||||||||||||||||||||||||
| |||||||||||||||||||||||||||||||||
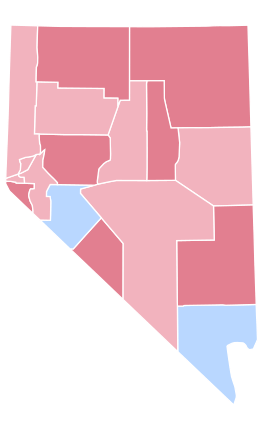
 County Results
| |||||||||||||||||||||||||||||||||
| |||||||||||||||||||||||||||||||||
| Elections in Nevada | ||||||||
|---|---|---|---|---|---|---|---|---|
 | ||||||||
|
||||||||
|
||||||||
|
||||||||
| None of These Candidates | ||||||||
A swing state, Nevada was narrowly won by incumbent Democratic President Bill Clinton. Clinton took a 43.93% plurality of the popular vote over Republican challenger Bob Dole, who took 42.91%, a victory margin of 1.02%. Reform Party candidate Ross Perot finished in third, with 9.47% of the popular vote.[1]
As of the 2016 presidential election, this is the last presidential election in which the Democratic candidate won Nevada without carrying Washoe County, and the last time Mineral County voted Democratic.[2] It is also the only time since 1960 that Nevada did not vote for the same candidate as Colorado.
Results
| 1996 United States presidential election in Nevada | |||||
|---|---|---|---|---|---|
| Party | Candidate | Votes | Percentage | Electoral votes | |
| Democratic | Bill Clinton (incumbent) | 203,974 | 43.93% | 4 | |
| Republican | Bob Dole | 199,244 | 42.91% | 0 | |
| Reform | Ross Perot | 43,986 | 9.47% | 0 | |
| N/A | None of these Candidates | 5,608 | 1.21% | 0 | |
| Green | Ralph Nader | 4,730 | 1.02% | 0 | |
| Libertarian | Harry Browne | 4,460 | 0.96% | 0 | |
| Independent American | Howard Phillips | 1,732 | 0.37% | 0 | |
| Natural Law | John Hagelin | 545 | 0.12% | 0 | |
| Totals | 464,279 | 100.00% | 4 | ||
Results by county
| County or City | William Jefferson Clinton[3] Democratic |
Robert Joseph Dole[3] Republican |
H. Ross Perot[3] Reform |
No Candidate[3] None of the Above |
Ralph Nader[3] Green |
Various candidates Other parties |
Margin | Total votes cast | |||||||
|---|---|---|---|---|---|---|---|---|---|---|---|---|---|---|---|
| # | % | # | % | # | % | # | % | # | % | # | % | # | % | ||
| Churchill | 2,282 | 29.40% | 4,369 | 56.28% | 821 | 10.58% | 125 | 1.61% | 56 | 0.72% | 110 | 1.42% | -2,087 | -26.88% | 7,763 |
| Clark | 127,963 | 48.71% | 103,431 | 39.37% | 23,177 | 8.82% | 2,655 | 1.01% | 1,902 | 0.72% | 3,582 | 1.36% | 24,532 | 9.34% | 262,710 |
| Douglas | 5,109 | 31.73% | 8,828 | 54.83% | 1,486 | 9.23% | 211 | 1.31% | 230 | 1.43% | 236 | 1.47% | -3,719 | -23.10% | 16,100 |
| Elko | 3,149 | 26.56% | 6,512 | 54.92% | 1,539 | 12.98% | 195 | 1.64% | 92 | 0.78% | 370 | 3.12% | -3,363 | -28.36% | 11,857 |
| Esmeralda | 140 | 25.64% | 277 | 50.73% | 91 | 16.67% | 14 | 2.56% | 7 | 1.28% | 17 | 3.11% | -137 | -25.09% | 546 |
| Eureka | 158 | 22.97% | 412 | 59.88% | 90 | 13.08% | 17 | 2.47% | 4 | 0.58% | 7 | 1.02% | -254 | -36.92% | 688 |
| Humboldt | 1,467 | 31.96% | 2,334 | 50.85% | 603 | 13.14% | 82 | 1.79% | 41 | 0.89% | 63 | 1.37% | -867 | -18.89% | 4,590 |
| Lander | 660 | 29.80% | 1,107 | 49.98% | 361 | 16.30% | 37 | 1.67% | 14 | 0.63% | 36 | 1.63% | -447 | -20.18% | 2,215 |
| Lincoln | 499 | 27.99% | 936 | 52.50% | 255 | 14.30% | 40 | 2.24% | 10 | 0.56% | 43 | 2.41% | -437 | -24.51% | 1,783 |
| Lyon | 3,419 | 35.25% | 4,753 | 49.01% | 1,104 | 11.38% | 134 | 1.38% | 113 | 1.17% | 176 | 1.81% | -1,334 | -13.75% | 9,699 |
| Mineral | 1,068 | 46.07% | 814 | 35.12% | 361 | 15.57% | 34 | 1.47% | 23 | 0.99% | 18 | 0.78% | 254 | 10.96% | 2,318 |
| Nye | 3,300 | 35.83% | 3,979 | 43.20% | 1,544 | 16.76% | 150 | 1.63% | 56 | 0.61% | 182 | 1.98% | -679 | -7.37% | 9,211 |
| Pershing | 565 | 36.01% | 743 | 47.36% | 203 | 12.94% | 28 | 1.78% | 15 | 0.96% | 15 | 0.96% | -178 | -11.34% | 1,569 |
| Storey | 614 | 37.10% | 705 | 42.60% | 244 | 14.74% | 30 | 1.81% | 37 | 2.24% | 25 | 1.51% | -91 | -5.50% | 1,655 |
| Washoe | 44,915 | 41.11% | 49,477 | 45.28% | 9,970 | 9.12% | 1,518 | 1.39% | 1,838 | 1.68% | 1,548 | 1.42% | -4,562 | -4.18% | 109,266 |
| White Pine | 1,397 | 39.97% | 1,399 | 40.03% | 546 | 15.62% | 66 | 1.89% | 29 | 0.83% | 58 | 1.66% | -2 | -0.06% | 3,495 |
| Carson City | 7,269 | 38.64% | 9,168 | 48.73% | 1,591 | 8.46% | 272 | 1.45% | 263 | 1.40% | 251 | 1.33% | -1,899 | -10.09% | 18,814 |
| Totals | 203,974 | 43.93% | 199,244 | 42.91% | 43,986 | 9.47% | 5,608 | 1.21% | 4,730 | 1.02% | 6,737 | 1.45% | 4,730 | 1.02% | 464,279 |
References
- "1996 Presidential General Election Results – Nevada". Dave Leip’s U.S. Election Atlas. Retrieved 30 January 2013.
- Sullivan, Robert David; ‘How the Red and Blue Map Evolved Over the Past Century’; America Magazine in The National Catholic Review; June 29, 2016
- Our Campaigns; NV US President 1996


