1945 Austrian legislative election
The elections to the Austrian National Council held on 25 November 1945 were the first after World War II. The elections were held according to the Austrian election law of 1929, with all citizens at least 21 years old eligible to vote,[1] however former Nazis were banned from voting, official sources putting their numbers at around 200,000.[2]
| |||||||||||||||||||||||||||||
165 seats in the National Council of Austria 83 seats needed for a majority | |||||||||||||||||||||||||||||
|---|---|---|---|---|---|---|---|---|---|---|---|---|---|---|---|---|---|---|---|---|---|---|---|---|---|---|---|---|---|
| |||||||||||||||||||||||||||||
| |||||||||||||||||||||||||||||
| This article is part of a series on the |
| Politics of Austria |
|---|
 |
|
|
|
|
|
|
|
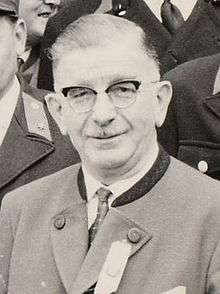
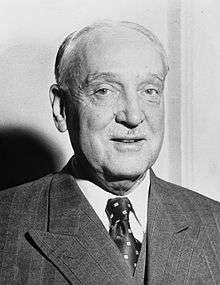
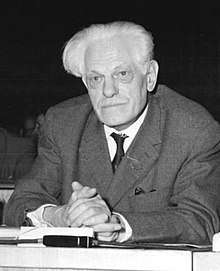
The Austrian People's Party, comprising elements of the prewar Christian Social Party under the leadership of Leopold Figl, won a decisive victory, receiving just under half of the vote and 85 of the 165 seats in the National Council. Despite having a two-seat majority, Figl continued with the three-party grand coalition alongside the Socialists and Communists. However, the Communists, who had been equally represented in the Renner government since the end of the war, only received one cabinet post.[3] On 20 December 1945 the Federal Assembly of Austria unanimously elected as President of Austria incumbent Chancellor Karl Renner of the Socialist Party, who swore in Figl as new chancellor on the same day.[4][5]
The Communists only gained four seats, which some blamed on the conduct of the Red Army in the Soviet occupied zone of Austria.[6] The Communists had assured the Soviets that they could win as much as 30 percent of the vote. This proved to be the beginning of a long decline for the Communists, though they stayed in the chamber until May 1959.
Results
| Parties | Votes | % | Seats | |
|---|---|---|---|---|
| Austrian People's Party (Österreichische Volkspartei) | 1,602,227 | 49.80 | 85 | |
| Socialist Party of Austria (Sozialistische Partei Österreichs) | 1,434,898 | 44.60 | 76 | |
| Communist Party of Austria (Kommunistische Partei Österreichs) | 174,257 | 5.42 | 4 | |
| Democratic Party of Austria (Demokratische Partei Österreichs) | 5,972 | 0.18 | 0 | |
| Invalid/blank votes | 35,975 | – | – | |
| Total (turnout 94%) | 3,253,329 | 100.0 | 165 | |
| Source: Nohlen, D & Stöver, P (2010). Elections in Europe: A data handbook. p. 213. | ||||
References
- Herald Journal - 24 November 1945 (Google News), retrieved 19 May 2010
- Ottawa Citizen - 23 November 1945 (Google News), retrieved 19 May 2010
- Federal Chancellery of Austria - Austrian Chancellors and Cabinets since 1945 Archived 2013-12-26 at the Wayback Machine, retrieved 19 May 2010
- President of Austria - Dr. Karl Renner Archived 2011-05-14 at the Wayback Machine, retrieved 19 May 2010
- Herald Journal - 21 December 1945 (Google News), retrieved 19 May 2010
- The Sydney Morning Herald - 27 November 1945 (Google News), retrieved 19 May 2010


