Tropical cyclones in 2020
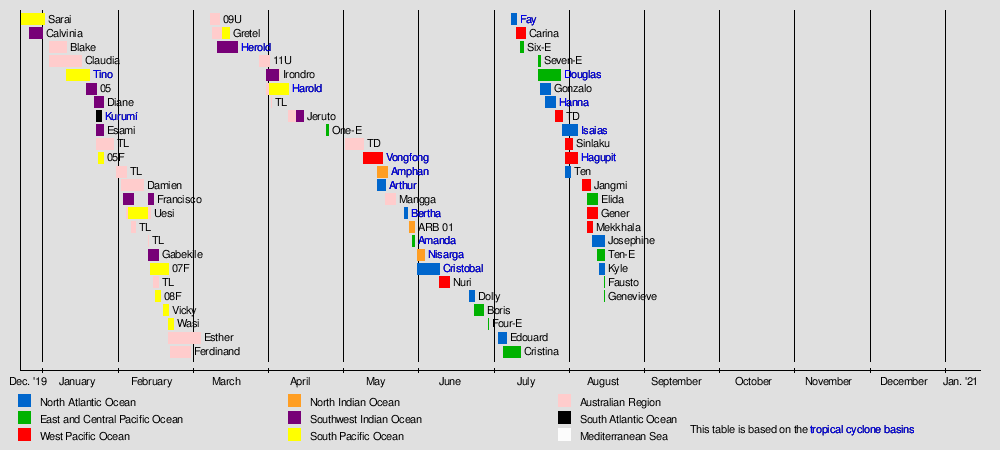
Throughout 2020, 69 tropical cyclones have formed in bodies of water known as tropical cyclone basins. Of these, 45 have been named, including a subtropical cyclone in the South Atlantic Ocean, by various weather agencies when they attained maximum sustained winds of 35 knots (65 km/h, 40 mph). The strongest storms of the year so far are Cyclone Harold in the South Pacific Ocean and Cyclone Amphan in the North Indian Ocean. The deadliest and costliest storm of the year was also Cyclone Amphan, causing over 100 fatalities in India, Sri Lanka, and Bangladesh.
| Tropical cyclones in 2020 | |
|---|---|
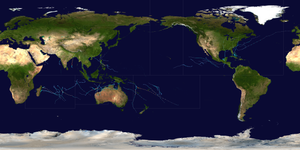 Year summary map | |
| Year boundaries | |
| First system | Blake |
| Formed | January 4, 2020 |
| Strongest system | |
| Name | Amphan and Harold |
| Lowest pressure | 920 mbar/hPa; 27.17 inHg |
| Longest lasting system | |
| Name | Esther |
| Duration | 13 days |
| Year statistics | |
| Total systems | 69 |
| Named systems | 46 |
| Total fatalities | 313 total, 2 missing |
| Total damage | > $20.96 billion (2020 USD) |
Tropical cyclones are primarily monitored by a group of ten warning centres, which have been designated as a Regional Specialized Meteorological Center (RSMC) or a Tropical Cyclone Warning Center (TCWC) by the World Meteorological Organisation. These are the United States National Hurricane Center (NHC) and Central Pacific Hurricane Center, the Japan Meteorological Agency (JMA), the Indian Meteorological Department (IMD), Météo-France, Indonesia's Badan Meteorologi, Klimatologi, dan Geofisika, the Australian Bureau of Meteorology (BOM), Papua New Guinea's National Weather Service, the Fiji Meteorological Service (FMS) as well as New Zealand's MetService. Other notable warning centres include the Philippine Atmospheric, Geophysical and Astronomical Services Administration (PAGASA), the United States Joint Typhoon Warning Center (JTWC), and the Brazilian Navy Hydrographic Center.
Global conditions
As 2020 began, sea surface temperatures were above normal in the eastern Pacific Ocean near the equator, which had the potential to develop into El Niño conditions. On January 9, a group of climate scientists writing for ENSO Blog published their forecast for atmospheric conditions. They believed that there was a 60% chance that the environment would remain in neutral conditions related to the El Niño–Southern Oscillation (ENSO); this was based on the expectation that the above normal water temperatures would return to normal.[1] By March, there was little evidence of increased rainfall near the equator. Trade winds were enhanced in the central and tropical Pacific Ocean, and water temperatures remained above normal. On April 9, ENSO Blog reaffirmed their belief that environmental conditions would remain neutral.[2] However, the SSTs near the equatorial pacific began to cool well below average, indicating a developing La Niña. As a result, the ENSO Blog issued La Niña watch, stating a 50-55% chance of a strong La Niña.[3]
Meanwhile in the Atlantic, SSTs were near normal in the early parts of the year. In spring, the SSTs began to warm up significantly in the Atlantic, with the Caribbean, Gulf of Mexico and the Main Development Region all having well above-average SSTs. This is mainly due to the developing La Niña.
The COVID-19 pandemic disrupted the response to tropical cyclones during the year. In the South Pacific island nation of Vanuatu, COVID-19, travel and social distancing restrictions associated with the pandemic were lifted for those seeking safe houses and evacuation shelters during Cyclone Harold.[4][5] When Typhoon Vongfong struck the Philippines in May, evacuation shelters were filled to half-capacity to comply with social distancing guidelines, requiring more evacuation centers to house refugees.[8] As a result of the use of schools as quarantine facilities for COVID-19, some schools could not be used as evacuation shelters.[9] When Cyclone Amphan was approaching India in May, shelter capacity in West Bengal was reduced from 500,000 people to 200,000 people due to social distancing restrictions.[10] Movement restrictions in El Salvador were temporarily lifted to allow people to purchase supplies ahead of Tropical Storm Amanda.[11]
Summary
Systems
January
The month of January was minimally active, and no tropical cyclones developed within the Northern Hemisphere, while 10 systems existed within the Southern Hemisphere. Six of these systems were named and had gale force winds, while two of these named storms developed hurricane-force winds and were classified as Severe tropical cyclones. As the month opened, both Tropical Cyclones Calvinia and Sarai were weakening and gradually dissipated over the next few days. Tropical Cyclone Blake subsequently became the first named storm of the year and made two landfalls in the Kimberley Region, bringing heavy rainfall throughout the region. Adding on, Cyclone Tino brought considerable damage throughout the South Pacific in the middle portion of the month, and a rare South Atlantic tropical cyclone formed, named Subtropical Storm Kurumí, becoming the first of its kind to be named in January later on in the month.
| Storm name | Dates active | Max wind km/h (mph) |
Pressure (hPa) |
Areas affected | Damage (USD) |
Deaths | Refs |
|---|---|---|---|---|---|---|---|
| Blake | January 4 – 11 | 75 (45) | 986 | Western Australia | Minor | None | |
| Claudia | January 4 – 17 | 150 (90) | 969 | Eastern Indonesia, Top End, Kimberley | None | None | |
| Tino | January 11 – 20 | 120 (75) | 970 | Solomon Islands, Vanuatu, Fiji, Wallis and Futuna, Samoan Islands, Tuvalu, Tonga | $5.83 million | None | |
| 05 | January 19 – 23 | 55 (35) | 999 | None | None | None | |
| Diane | January 22 – 26 | 95 (60) | 980 | Madagascar, Mauritius, Réunion | Unknown | 31 | |
| Kurumí | January 23 – 25 | 65 (40) | 998 | São Paulo | None | 3 | |
| Esami | January 23 – 26 | 75 (45) | 993 | Rodrigues | None | None | |
| TL | January 23 – 30 | Unspecified | 998 | Northern Territory, Queensland | None | None | |
| 05F | January 24 – 26 | Unspecified | 1003 | Samoan Islands | None | None | |
| TL | January 31 – February 4 | Unspecified | 1007 | Christmas Island, Cocos Islands | None | None |
February
The month of February was active, seeing 13 tropical cyclones develop, with eight being named. Cyclone Damien became the first and strongest storm of the month, impacting the Pilbara Region of Western Australia as a high-end Category 2 cyclone on the Saffir-Simpson scale. Cyclone Uesi also impacted the east coast of Australia and New Caledonia, killing 1 person. Later in the month, activity increased in the South Pacific with Cyclones Vicky and Wasi forming, bringing heavy rain to the Samoan Islands. Consequently, activity also increased in the Australian basin with Cyclone Esther and Ferdinand forming, with Ferdinand staying well north of the Australian coastline its entire lifetime.
| Storm name | Dates active | Max wind km/h (mph) |
Pressure (hPa) |
Areas affected | Damage (USD) |
Deaths | Refs |
|---|---|---|---|---|---|---|---|
| Damien | February 2 – 11 | 170 (105) | 955 | Northern Australia, Kimberley | Moderate | None | |
| Uesi | February 3 – 15 | 120 (75) | 970 | Solomon Islands, Vanuatu, New Caledonia, Lord Howe Island, New Zealand, New South Wales, South East Queensland | Minor | 1 | |
| Francisco | February 3 – 15 | 80 (50) | 994 | Madagascar | Minor | 1 | |
| TL | February 6 – 8 | Unspecified | 1007 | Cocos Islands | None | None | |
| TL | February 13 | Unspecified | 1009 | None | None | None | |
| Gabekile | February 13 – 17 | 130 (80) | 976 | None | None | None | |
| 07F | February 14 – 21 | Unspecified | 998 | Tuvalu, American Samoa, Tokelau | None | None | |
| TL | February 15 – 17 | Unspecified | 1002 | Solomon Islands | None | None | |
| 08F | February 17 – 18 | 65 (40) | 994 | American Samoa, Niue | None | None | |
| Vicky | February 19–22 | 85 (50) | 988 | Samoan Islands, Niue | None | None | |
| Wasi | February 21 – 23 | 85 (50) | 990 | Wallis and Futuna, Samoan Islands | None | None | |
| Esther | February 21 - March 5 | 75 (45) | 988 | Far North Queensland, Northern Territory, Kimberley | None | None | |
| Ferdinand | February 22 – March 4 | 155 (100) | 960 | Lesser Sunda Islands | None | None |
March
With only four tropical cyclones forming in March, the month is currently the least active of 2020. Despite that, Cyclones Gretel and Herold formed; with the latter becoming the first major tropical cyclone of 2020.
| Storm name | Dates active | Max wind km/h (mph) |
Pressure (hPa) |
Areas affected | Damage (USD) |
Deaths | Refs |
|---|---|---|---|---|---|---|---|
| 09U | March 9 – 14 | 75 (45) | 999 | Java, Bali, West Nusa Tenggara Western Australia | None | None | |
| Gretel | March 10 – 17 | 100 (65) | 980 | Top End, New Guinea, Queensland, New Caledonia, Norfolk Island, New Zealand | None | None | |
| Herold | March 12 – 20 | 175 (110) | 957 | Madagascar, Tromelin Island | None | 5 | [12] |
| 11U | March 29 – April 2 | Unspecified | 1005 | New Guinea, Cape York Peninsula | None | None |
April

The month of April was fairly inactive with only five storms developing and three being named, however the month featured Cyclone Harold responsible for devastating damage in Vanuatu and the first category 5-equivalent storm of 2020, as well as the first to be featured in the South Pacific since Cyclone Gita in 2018. It also featured Tropical Depression One-E in the Eastern Pacific, becoming its earliest forming tropical cyclone in the basin proper, and the first storm in the Northern Hemisphere in 2020.
| Storm name | Dates active | Max wind km/h (mph) |
Pressure (hPa) |
Areas affected | Damage (USD) |
Deaths | Refs |
|---|---|---|---|---|---|---|---|
| Irondro | April 1 – 7 | 175 (110) | 945 | None | None | None | |
| Harold | April 1 – 11 | 230 (145) | 920 | Eastern Papua New Guinea, Solomon Islands, Vanuatu, Fiji, Tonga | >$123.5 million | ≥30 | |
| TL | April 3 | Unspecified | 1008 | None | None | None | |
| Jeruto | April 10 – 16 | 65 (40) | 1000 | None | None | None | |
| One-E | April 25 – 26 | 55 (35) | 1006 | None | None | None |
May

The month of May was marginally active with eight tropical cyclones developing and six of those being named. Typhoon Vongfong (Ambo) became the first storm of the Pacific Typhoon season; marking the latest start to the basin since 2016 and dealing significant damage in the Philippines. Tropical Storm Arthur also developed in the month, giving the North Atlantic season six consecutive seasons with pre-season activity. Cyclone Amphan became the strongest of the month, and also became one of the strongest cyclones in the North Indian Ocean on record as well as the costliest storm in the basin on record. Later in the month, Tropical Cyclone Mangga formed as an off-season tropical storm in the Australian region. Furthermore, Tropical Storm Bertha formed in the Atlantic and marked the first time since 2016 that two pre-season storms have formed in the Atlantic, as well as the first time since 2012 that two tropical depressions or storms formed in the month of May.
| Storm name | Dates active | Max wind km/h (mph) |
Pressure (hPa) |
Areas affected | Damage (USD) |
Deaths | Refs |
|---|---|---|---|---|---|---|---|
| TD | May 3–10 | 55 (35) | 1004 | Mentawai Islands, Sumatra | None | None | |
| Vongfong (Ambo) | May 10–18 | 155 (100) | 960 | Palau, Philippines, Taiwan, Ryukyu Islands | $31.1 million | 5 | |
| Amphan | May 16–21 | 240 (150) | 920 | Sri Lanka, Bangladesh, India, Bhutan | >$13.6 billion | 128 | |
| Arthur | May 16–19 | 95 (60) | 991 | Cuba, Florida, The Bahamas, North Carolina, Bermuda | Minimal | None | |
| Mangga | May 19 – 23 | 65 (40) | 995 | Cocos Islands, Mentawai Islands, Sumatra, Western Australia | None | None | |
| Bertha | May 27–28 | 85 (50) | 1004 | Florida, Bahamas, East Coast of the United States | >$200 million | 1 | |
| ARB 01 | May 29–31 | 45 (30) | 1000 | Oman, Yemen | Unknown | 3 | |
| Amanda | May 30–31 | 65 (40) | 1003 | Guatemala, El Salvador, Honduras, Belize, Costa Rica | >$200 million | 33 |
June

June was slightly inactive with just 6 tropical cyclones forming and five of them being named. In the Northern Indian Ocean, Cyclone Nisarga formed near southwest India and historically affected the cities of Alibag and Mumbai. Tropical Storm Cristobal formed from the remnants of Tropical Storm Amanda in May and affected Mexico and the United States, becoming the earliest third named storm in the North Atlantic Ocean on record. Tropical Storm Nuri (Butchoy) formed on the eastern coast of the Philippines, becoming the second storm of the typhoon season in the West Pacific but quickly weakened before landfall. Near the end of the month, Tropical Storm Dolly formed in the North Atlantic Ocean and became the third-earliest fourth named storm in the basin on record but remained far out to sea.
| Storm name | Dates active | Max wind km/h (mph) |
Pressure (hPa) |
Areas affected | Damage (USD) |
Deaths | Refs |
|---|---|---|---|---|---|---|---|
| Nisarga | June 1–4 | 110 (70) | 984 | West India | $665 million | 6 | |
| Cristobal | June 1–10 | 95 (60) | 992 | Guatemala, El Salvador, Belize, Mexico, Gulf Coast of the United States, Midwestern United States, Eastern Canada | $675 million | 5 | |
| Nuri (Butchoy) | June 10–15 | 75 (45) | 996 | Philippines, China | Unknown | 1 | |
| Dolly | June 22–24 | 75 (45) | 1002 | Bermuda | None | None | |
| Boris | June 24 – 28 | 65 (40) | 1005 | None | None | None | |
| Four-E | June 30 | 55 (35) | 1004 | None | None | None |
July

The month of July was active, with 14 tropical cyclones forming and 9 being named. Tropical Storm Edouard which developed on July 4, officially became the earliest-forming fifth named storm in the basin on July 6, surpassing the July 11 record set by 2005's Hurricane Emily. It was later joined by Tropical Storm Fay on July 9, which became the earliest-forming sixth named storm in the basin, surpassing the previous July 21 record set by 2005's Tropical Storm Franklin. In the West Pacific, the third tropical depression of the extremely quiet 2020 Pacific typhoon season formed on July 11. Hurricane Douglas then became one of the latest first hurricanes in the Eastern Pacific and would become the first major hurricane of the pacific hurricane season. Then near the end of the month, Tropical Storm Gonzalo, Hurricane Hanna and Hurricane Isaias marked the earliest seventh, eighth, and ninth-named storms on record in the Atlantic, beating the record set by Tropical Storm Gert, Tropical Storm Harvey, and Hurricane Irene all in 2005, respectively.
| Storm name | Dates active | Max wind km/h (mph) |
Pressure (hPa) |
Areas affected | Damage (USD) |
Deaths | Refs |
|---|---|---|---|---|---|---|---|
| Edouard | July 4 – 6 | 75 (45) | 1007 | Bermuda, East Coast of the United States | Minimal | None | |
| Cristina | July 6 – 13 | 110 (70) | 993 | Socorro Island | None | None | |
| Fay | July 9 – 11 | 95 (60) | 998 | East Coast of the United States, New England | $400 million | 6 | |
| Carina | July 11 – 15 | 55 (35) | 1004 | Philippines, Taiwan | None | None | |
| Six-E | July 13 – 14 | 55 (35) | 1007 | None | None | None | |
| Seven-E | July 20 – 21 | 55 (35) | 1007 | None | None | None | |
| Douglas | July 20 – 29 | 215 (130) | 954 | Hawaii | None | None | |
| Gonzalo | July 21 – 25 | 100 (65) | 997 | Windward Islands, Trinidad and Tobago, Venezuela, Leeward Islands | None | None | |
| Hanna | July 23 – 27 | 150 (90) | 973 | Hispaniola, Cuba, Gulf Coast of the United States, Mexico | >$500 million | 5 | |
| TD | July 27 – 30 | Not specified | 1010 | None | None | None | |
| Isaias | July 30 – August 5 | 140 (85) | 987 | Windward Islands, Puerto Rico, Dominica, Hispaniola, Turks and Caicos Islands, East Coast of the United States, Eastern Canada | >$4.2 billion | 18 | |
| Sinlaku | July 31 – August 3 | 65 (40) | 992 | South China, Vietnam | None | 6 | |
| Hagupit (Dindo) | July 31 – August 5 | 130 (80) | 975 | Ryukyu Islands, Taiwan, East China | $411 million | 12 | |
| Ten | July 31 – August 2 | 55 (35) | 1007 | West Africa, Cabo Verde Islands | None | None |
August
So far, August has been active, with 10 tropical cyclones and 7 named storms. Tropical Storms Josephine and Kyle became the earliest 10th and 11th named storm on record in the Atlantic, forming on August 13 and 14 respectively, surpassing Tropical Storm Jose and Hurricane Katrina in 2005, by 9 and 10 days. In the eastern Pacific, the tropical storms Fausto and Genevieve kept the activity going.
| Storm name | Dates active | Max wind km/h (mph) |
Pressure (hPa) |
Areas affected | Damage (USD) |
Deaths | Refs |
|---|---|---|---|---|---|---|---|
| Jangmi (Enteng) | August 7 – 10 | 85 (50) | 996 | Philippines, Ryukyu Islands, Korean Peninsula | None | None | |
| Elida | August 9 – 13 | 155 (100) | 975 | Mexico, Socorro Island | None | None | |
| Mekkhala (Ferdie) | August 9 – 11 | 95 (60) | 992 | Philippines, Taiwan, East China | None | None | |
| 06W (Gener) | August 9 – 13 | 55 (35) | 1012 | None | None | None | |
| Josephine | August 11 – 16 | 75 (45) | 1005 | None | None | None | |
| Ten-E | August 13 – 16 | 55 (35) | 1004 | None | None | None | |
| Kyle | August 14 - 16 | 85 (50) | 1000 | East Coast of the United States | None | None | |
| Fausto | August 16 – Present | 65 (40) | 1004 | None | None | None | |
| Genevieve | August 16 – Present | 75 (45) | 1004 | None | None | None | |
| TD | August 16 - Present | <55 (35) | 1006 | Luzon, Philippines | None |
Global effects
- The sum of the number of systems and fatalities in each basin will not equal the number shown as the total. This is because when systems move between basins, it creates a discrepancy in the actual number of systems and fatalities.
Notes
2 Only systems that formed either on or after January 1, 2020 are counted in the seasonal totals.
3 Only systems that formed either before or on December 31, 2020 are counted in the seasonal totals.
4 The wind speeds for this tropical cyclone/basin are based on the IMD Scale which uses 3-minute sustained winds.
5 The wind speeds for this tropical cyclone/basin are based on the Saffir Simpson Scale which uses 1-minute sustained winds.
6The wind speeds for this tropical cyclone are based on Météo-France which uses wind gusts.
References
- Emily Becker (January 9, 2020). "January 2020 ENSO update: new year, new you". Retrieved April 15, 2020.
- Michelle L'Heureux (April 9, 2020). "April 2020 ENSO Update: Alternative Communication". Retrieved April 15, 2020.
- "July 2020 ENSO update: La Niña Watch! | NOAA Climate.gov". www.climate.gov. Retrieved 2020-07-23.
- Tahana, Jamie (April 5, 2020). "'Bad timing': Cyclone Harold likely to hit Vanuatu as category 5". RNZ. Radio New Zealand. Retrieved April 4, 2020.
- Kottasová, Ivana; Miller, Brandon (April 6, 2020). "Giant storm hits Vanuatu amid coronavirus state of emergency". CNN. Cable News Network. Retrieved April 6, 2020.
- "Sorsogon imposes distancing measure in evac centers amid threat of Typhoon Ambo". ABS-CBN News. ABS-CBN Corporation. May 14, 2020. Retrieved May 14, 2020.
- "NDRRMC urges LGUs to prepare for 'Bagyong Ambo'". PTV News. People's Television Network, Inc. May 13, 2020. Retrieved May 13, 2020.
- Brackett, Ron (18 May 2020). "India, Bangladesh Tell Millions to Evacuate as Tropical Cyclone Amphan Approaches". The Weather Channel. TWC Product and Technology. Retrieved 20 May 2020.
- "Hurricane Amanda kills 14 people in El Salvador". Seven News. June 1, 2020. Retrieved June 1, 2020.
- 17 March 2020. "Herold drenches Madagascar". Retrieved 24 March 2020.
External links
Regional Specialized Meteorological Centers
- US National Hurricane Center – North Atlantic, Eastern Pacific
- Central Pacific Hurricane Center – Central Pacific
- Japan Meteorological Agency – NW Pacific
- India Meteorological Department – Bay of Bengal and the Arabian Sea
- Météo-France – La Reunion – South Indian Ocean from 30°E to 90°E
- Fiji Meteorological Service – South Pacific west of 160°E, north of 25° S
Tropical Cyclone Warning Centers
- Meteorology, Climatology, and Geophysical Agency of Indonesia – South Indian Ocean from 90°E to 141°E, generally north of 10°S
- Australian Bureau of Meteorology (TCWC's Perth, Darwin & Brisbane) – South Indian Ocean & South Pacific Ocean from 90°E to 160°E, generally south of 10°S
- Papua New Guinea National Weather Service – South Pacific Ocean from 141°E to 160°E, generally north of 10°S
- Meteorological Service of New Zealand Limited – South Pacific west of 160°E, south of 25°S
![]()